Bjorn Lomborg Profile picture
Jul 19, 2019 4 tweets 3 min read Read on X
Unbridled alarmism:

No, our current trajectory is about 4°C, not 6°C

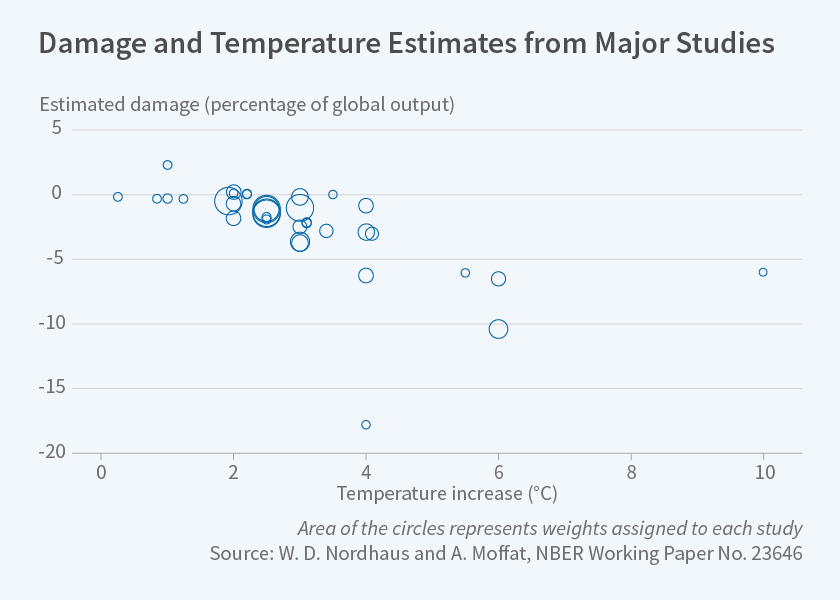
No, 4°C is not the end-of-the-world, it is a problem, equivalent to reducing average income by about 3-4% in 2100 (when OECD will be 200-500% as rich as today and Africa 300-2,200% richer)
Here is the UN Climate Panel estimate of damages, updated by Nobel Laureate Nordhaus

nber.org/reporter/2017n…
Here is the UN Climate Panel estimates of incomes
sciencedirect.com/science/articl…

OECD/Africa accessible here: tntcat.iiasa.ac.at/SspDb/dsd
The new 1.5°C UN Climate Panel report quoted the cost of
1.5°C at 0.3% of GDP by 2100
2°C at 0.5% of GDP by 2100
3.6°C at 2.6% of GDP by 2100

Problem, not by ANY standards end-of-world
p256, ipcc.ch/sr15/chapter/c…

• • •

Missing some Tweet in this thread? You can try to force a refresh
 

Keep Current with Bjorn Lomborg

Bjorn Lomborg Profile picture

Stay in touch and get notified when new unrolls are available from this author!

Read all threads

This Thread may be Removed Anytime!

PDF

Twitter may remove this content at anytime! Save it as PDF for later use!

Try unrolling a thread yourself!

how to unroll video
  1. Follow @ThreadReaderApp to mention us!

  2. From a Twitter thread mention us with a keyword "unroll"
@threadreaderapp unroll

Practice here first or read more on our help page!

More from @BjornLomborg

Jul 6
Today, the Great Barrier Reef is better than ever

But 12 years ago, we were told about the "Great Reef Catastrophe"

and how the reef would be almost gone today

Moral of the story: Don't always believe the scare stories

Refs in🧵
Here is the 2012 article telling us about the terrible state of the Great Barrier Reef

and about how it will almost halve again by 2022 to 5-10%

pnas.org/doi/10.1073/pn…

Image
Image
Read 4 tweets
Jul 2
Doesn't fit the narrative, but

2024 record coral cover for Great Barrier Reef

Based on official data for all 11 sectors of GBR,

Last three years, 2022-2024, have been unprecedented

Data: apps.aims.gov.au/reef-monitorin…Image
Official, reef-wide average widely published as the Great Barrier Reef got worse

But when it got better, official average stopped

Here is the optimal average (least-square) based on their 11 published sectors,

Last official reef-wide average: apps.aims.gov.au/reef-monitorin…
aims.gov.au/reef-monitorin…Image
In 2014, the eco-worried Guardian wrote the obituary of the Great Barrier Reef

Last three years, the Great Barrier Reef has been better than ever since records started in 1986

Moral: Don't believe all scare stories theguardian.com/environment/ng…Image
Read 4 tweets
Feb 20
Climate alarmists are annoyed that global climate-related disaster deaths have declined dramatically

Then they discovered how to cherry-pick deaths to look like they’re increasing

— just (indefensibly) remove the top 50 most deadly mega-disasters and rig the scales

🧵+refsImage
After manipulating their stats, they have the temerity to claim “Misinterpreting statistics could be harmful if it supports a discourse minimizing the importance of climate action”

I’m pretty sure misinterpreting statistics is wrong no matter what

, p7cred.be/sites/default/…Image
They show low death numbers from 1900s and 1910s, but these are likely wrong ()

They have left out at least two major catastrophes, likely missing at least 20-25 million deaths from the Chinese flood in 1906, leading to famine in 1906-07, and at least 2-10 million deaths from the Persian drought leading to famine in 1917-19


sciencedirect.com/science/articl…
en.wikipedia.org/wiki/Chinese_f…
en.wikipedia.org/wiki/Persian_f…Image
Read 8 tweets
Feb 4
CO₂ and climate make the world greener

Over 2001-20 the world added so many new leaves

the additional leaf area is equivalent to 1.4x the area of the Contiguous US

Climate net problem

but breathless reporting ignores an ever-greening world

sciencedirect.com/science/articl…Image
CO₂ makes world greener

Every two seconds global leaf area grows by 5 soccer pitches

Every year, the world adds almost three Great Britains of additional leaf area

Climate net problem, but breathless reporting ignores an ever-greening world

sciencedirect.com/science/articl…Image
Global greening happens over most of the world, but especially in China, India, Europe, African Sahel (the greening of the Sahel), Southern Brazil and across US/Canada

Much of this is from forests and increased cropping in croplands

nature.com/articles/s4189…
Image
Read 10 tweets
Jan 16
Gasoline, not electric cars:

Two-thirds of American's want their next car to be fossil fuel driven, with just 6% battery-electric

Deloitte new 2024 Global Automotive Consumer Study

Key trend: "Slowing EV (electric car) momentum"

deloitte.com/global/en/Indu…Image
Electric cars: Consumers worry

They worry about charging time, range anxiety,
cost, battery safety, and availability of charging infrastructure

deloitte.com/global/en/Indu…
Image
We're being told that electric cars will take over the US

But Biden's Energy Information Administration estimates that by 2050, 84% of all cars will still run on fossil fuels


Image
Read 4 tweets
Jan 14
Climate alarmists incessantly hype extreme weather

But global climate-related disaster costs are declining

This decline is not just evident globally but also for rich and poor countries, and for flood, flash flood, coastal flood, cold, drought, wind, and all damage

Why don't we hear this?

Notice, damage is measured in % GDP, as even the UN insists on measuring it (e.g. SDG 11.5.2, )

This is because the same flood or storm will create much more damage in a much richer world:

If there are twice as many houses, a flood will tend to damage twice as many houses

Update of academic paper:


unstats.un.org/sdgs/metadata/…
tandfonline.com/doi/full/10.10…
rogerpielkejr.substack.com/p/global-disas…
Image
Cost of climate-related disasters has dropped nearly 5-fold since 1980

True for both richer and poorer countries and for all countries

sciencedirect.com/science/articl…Image
Cost of nearly all climate-related disasters have dropped dramatically over 1980-2016

True for both richer, poorer and all countries, at 50, 100, 200 and 400km

sciencedirect.com/science/articl…
Image
Read 8 tweets

Did Thread Reader help you today?

Support us! We are indie developers!


This site is made by just two indie developers on a laptop doing marketing, support and development! Read more about the story.

Become a Premium Member ($3/month or $30/year) and get exclusive features!

Become Premium

Don't want to be a Premium member but still want to support us?

Make a small donation by buying us coffee ($5) or help with server cost ($10)

Donate via Paypal

Or Donate anonymously using crypto!

Ethereum

0xfe58350B80634f60Fa6Dc149a72b4DFbc17D341E copy

Bitcoin

3ATGMxNzCUFzxpMCHL5sWSt4DVtS8UqXpi copy

Thank you for your support!

Follow Us!

:(