Stephen McIntyre Profile picture
Aug 7, 2019 17 tweets 6 min read Read on X
Here are two series which were included in PAGES 2017 - both from Pakistan (from about same latitude as bristlecone pines.) One went up in late 20th, one went down. Guess which one was selected into PAGES 2019. Cherry-picking by climatists has gone well beyond being a joke. Image
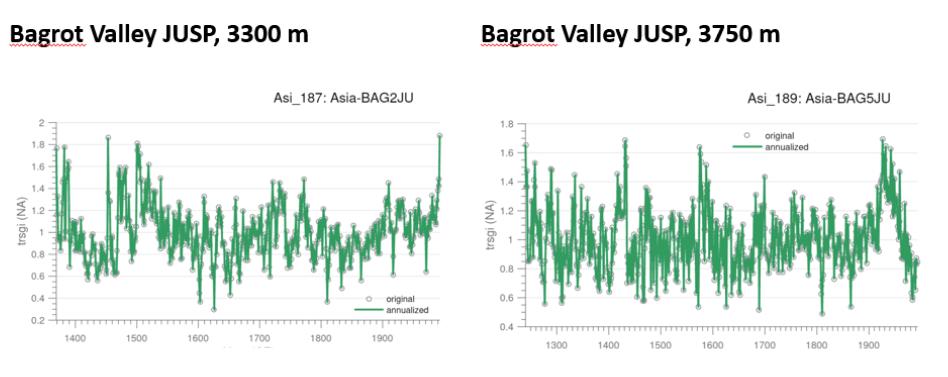
2/ here's another example from PAGES2K Asian network: two juniper (JUSP) sites at different elevations in Bagrot Valley, Pakistan. One had upspike at very end, the other had decline. No points for guessing which is in PAGES2019. Image
3/ another contradiction: in the SW US at near-identical latitude, lower boundary trees said to be precipitation proxies, while upper boundary (higher altitude) more temperature related. Even at upper boundary, very dry in US and validity as temperature proxy questionable.
4/ from 229 Asia tree ring sites in PAGES 2019 (already screened), PAGES 2019 selected 47 sites according to criteria which accentuated 20th century increase. More sites from each of Mongolia and Pakistan than either Russia or China Image
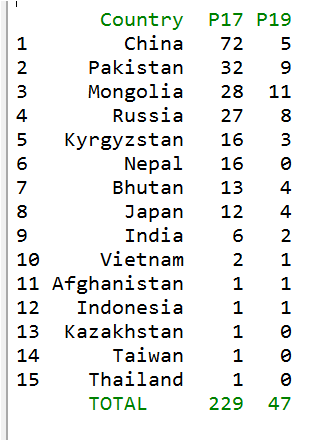
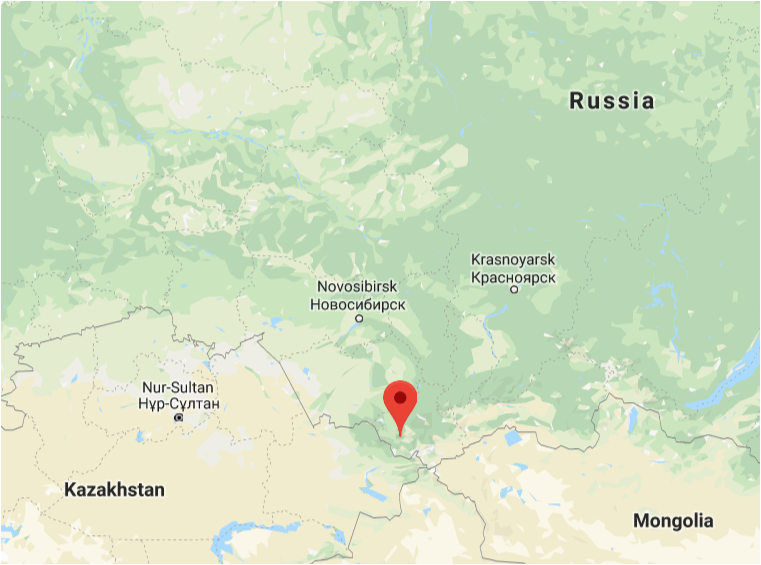
5/ of 8 Russian tree ring series in PAGES 2019, 7 (!?!) come from exactly the same site: Ust Koksa Hill, Altai (ring width, early width, late width, max density, min density, late density, early density). Site at tricorner of Russia, Kazakh and Mongolia. Other site EAST of Japan.

Image
Image
Image
6/ the Briffa troika of Russian tree ring sites (Yamal, Taimyr and the bodged version of Polar Urals) are used in PAGES2019 Arctic network, rather than Asia network.
7/ here's another puzzling and potentially serious PAGES 2019 problem -one which also impacts PAGES 2017 and PAGES 2013. I spot checked tree ring series with highest 2005 values - two over 4.4 SD units - paki033 and indo005. Note that a couple of authors over-represented. Image
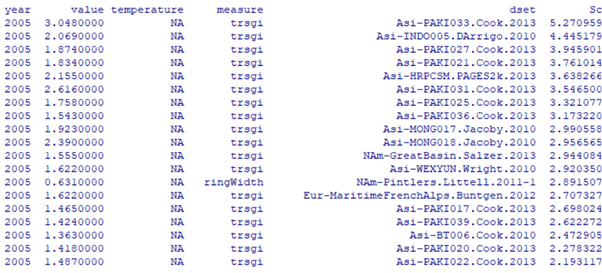
most extreme (over 5 SD units in 2005) was paki033, a PIGE series from Pakistan (35 30N; 74 45E). It is used in PAGES 2013, PAGES 2017 and PAGES 2019. PAGES version has dramatic upspike, since 1991 and especially since 2002. Image
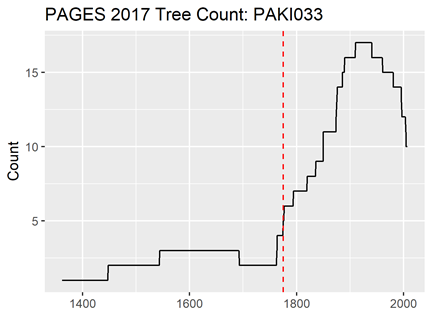
measurement data is at NOAA . Examining the underlying data, there are some issues. Usually, tree ring specialists require 10+ cores for valid chronology (exceptionally 5+ cores). paki033 doesn’t have 5 cores until 1776, only 2 cores as late as 1762. www1.ncdc.noaa.gov/pub/data/paleo…
Image
but there's something MUCH worse. paki033 chronology NOT archived, only measurements. I calculated chronology using standard technique. Totally different result: no huge late upspike. Instead long decline with modest late recovery. ??!?? @onturenio, you should look at this Image
@onturenio I had similar problem when I tried to replicate chronology for INDO005: instead of the dramatic upspike of PAGES2K series, I obtained only a minor recovery from long decline. Image
@onturenio The Asian tree ring series in PAGES2017 were identical to the Asia tree ring data in PAGES 2013. To my knowledge, the PAGES 2013 chronologies had not been previously published in a technical publication, instead appearing first in PAGES 2013.
@onturenio I've triple checked the calculations. While the versions differ dramatically, they also clearly come from the same data (due to high frequency similarity). Where did PAGES2K chronologies for paki033 and indo005 come from? How were they calculated?
@onturenio this doesn't impact ALL the series. Chronology for nearby paki027 site is easily replicated. Not sure what's going on with the two series shown above. They emerged from spot check of high closers, not cherry pick from examining numerous series. Image
@onturenio here's another PAGES tree ring chronology PAKI021 - where PAGES version goes up, while chronology calculated from underlying measurement data at NOAA goes down.
Kalash Valley Bumburet - PIGE. Used in P13, P17 and P19. Image
@onturenio one more Pakistan tree ring series (PAKI036) in which PAGES version is more HS than chronology calculated from underlying data according to standard method. Less dramatic difference than others, but still very distinct. Image
@onturenio the NOAA archive for this measurement data gives PAGES2K (2013) as academic citation -NOT a specialist publication of the Pakistan tree ring data.

• • •

Missing some Tweet in this thread? You can try to force a refresh
 

Keep Current with Stephen McIntyre

Stephen McIntyre Profile picture

Stay in touch and get notified when new unrolls are available from this author!

Read all threads

This Thread may be Removed Anytime!

PDF

Twitter may remove this content at anytime! Save it as PDF for later use!

Try unrolling a thread yourself!

how to unroll video
  1. Follow @ThreadReaderApp to mention us!

  2. From a Twitter thread mention us with a keyword "unroll"
@threadreaderapp unroll

Practice here first or read more on our help page!

More from @ClimateAudit

May 12
in April 2022, Mark Steyn, on his GB News show
,
commented on recently released UK COVID data, claiming "the third booster shots so zealously promoted by the British state, and its groupthink media has failed, and in fact exposed you to significantly greater risk of infection, hospitalization and death."
Steyn showed images of five tables from official statistical publications to support his claims.
In April 2023, Ofcom, which, in addition to its ordinary regulatory role, had taken a special interest in vaccine advocacy, ruled that Steyn's "presentation of UK Health Security Agency data
and their use to draw conclusions materially misled the audience. In breach of Rule 2.2 of the Broadcasting Code" - a very damaging finding that Steyn has appealed.


I haven't followed this case. However, as it happens, I had taken an interest in UK COVID data about 3 months earlier, as it was one of the few jurisdictions that published case and hospitalization rates by vaccination status.


Also, to refresh readers on the contemporary context, early 2022 was the period in which COVID lockdowns and overall alarm began to decline.

At the time, I observed that the UK data showed that the case rate for triple vax was //higher// than among unvax. Three months later, Steyn (as discussed below) made a similar claim, for which he was censured.

Although the UK authorities conspicuously refrained from including this result in their summary or conclusions, they were obviously aware of the conundrum, since their publication included a curious disclaimer by UK authorities that actual case data "should not be used" to estimate vaccine effectiveness. I pointed this odd disclaimer out in this earlier thread, also noting that health authorities in Ontario and elsewhere had previously used such data to promote vaccine uptake and that the reasoning behind this disclaimer needed to be closely examined and parsed.

All of these issues turned up later in the Ofcom decision re Steyn.

Ofcom ruled that Steyn's presentation was "materially misleading" because
(1) he failed to take account of "fundamental biases" in age structure of vax and unvax groups i.e. unvax group was skewed younger, vax group skewed older; and
(2) he failed to include the disclaimer that "This raw data should not be used to estimate vaccine effectiveness as the data does not take into account inherent biases present such as differences in risk, behaviour and testing in the vaccinated and unvaccinated populations”.steynonline.com/mark-steyn-sho…
ofcom.org.uk/__data/assets/…
Image
in this thread, I'll re-examine Steyn's analysis. I've transcribed all the numbers in the tables and done further calculations to check his claims.

First, case rates. Steyn first showed an important table showing the population by 5-year age group and vax status, observing that the total population of triply vax (boosted) was approximately equal to the population of unboosted, observing that this facilitated comparison. Steyn: "Let's take a look at this, as you can see from a pool of 63 million down at the bottom there, 63 million, there are 32 million who are triple vaccinated. That leaves just under 31 million, who are either double single or unvaccinated. So we have two groups of similar size, 31, 32 million. So it's relatively easy to weigh the merits of the third shot upon Group A versus group B."

He then showed a table of cases by age group and vax status, pointing out that the total number of boosted cases was approximately double the number of unboosted cases: "So the triple vaccinated in March were responsible for just over a million COVID cases and everybody else 475,000 COVID cases. So the triple vaccinated are contracting COVID at approximately twice the rate of the double, single and unvaccinated. Got that? If you get the booster shot, you've got twice as high a chance of getting the COVID. In the United Kingdom, there's twice as many people with the third booster shot who got the COVID, as the people who never had the booster shot."Image
Image
Ofcom purported to rebut Steyn's analysis as shown in excerpt below. They observed that proportion of unvax in younger age groups was much higher than in older age groups and that the "simple comparison between the two groups made by Mark Steyn failed to take into account these inherent biases".

However, Ofcom failed to show that there would be a different outcome in the more complex analysis in which age groups were allowed for.

As it turns out, in regard to case rates, Steyn's conclusions, if anything, under-stated the phenomenon, as shown next.Image
Read 11 tweets
Apr 19
here is a thread from 2023 in which Eric Ciaramella's "yikes" is placed in a more detailed context.

In this thread, I suggested that the linkage was connected to Jan 21, 2016 meeting of Ukrainian prosecutors with State Dept officials, noting that Jamie Gusack (reporting to Bridget Brink) had distributing the first demand for Shokin's head (Nov 22 TPs)Image
Image
as pointed out in that thread, Gusack (State Dept) had been coordinating with Ciaramella (NSC) prior to arrival of Ukr prosecutors in Jan 2016, referring to Shokin replacement.

State Dept cited "diamond prosecutors case" as big deal. But what happened to it next? A long story. Image
Bridget Brink, Jamie Gusack's boss, reported to Victoria Nuland. Brink was appointed Ambassador to Ukraine in April 2022. Unanimous approval by Senate in early days of war at the exact time that US and UK were sabotaging the peace deal negotiated in Istanbul Image
Read 4 tweets
Mar 17
as observed yesterday, , after 2014 US coup, the tsunami of billion dollar US/IMF loans was associated with unprecedented embezzlement by Ukr oligarchs thru corrupt Ukr banking system. Rescues of failed banks (mostly unnoticed in west) were markers
in today's thread, I'll provide a short bibliography of articles (mostly Ukrainian language via google translate) on the Ukr banking corruption crisis that began and exploded after the 2014 US coup, while Biden, Blinken, Nuland et al were running Ukraine
once one searches specifically for the topic, there are interesting references, but the topic has received essentially next to zero coverage in the west. I'll take myself as an example. Despite following Ukr affairs quite closely, my prior knowledge was three vignettes.
Read 15 tweets
Mar 16
May 25, 2021: US DOJ announced indictment & arrest of Austrian banker Peter Weinzierl


Mar 13, 2024: we learn that Alexander Smirnov was an FBI informant against Weinzierl and had lured Weinzierl to UK on behalf of FBI for arrest justice.gov/usao-edny/pr/t…
archive.is/zO1rt

Image
Image
the DOJ charges against Austrian banker Weinzierl, filed during first six months of Biden admin, pertained to allegations that payments made via Meinl Bank in Austria by Brazilian construction company Odebrecht were connected to evasion of taxes in Brazil. Image
if the concern of US DOJ and FBI with administration of Brazilian tax collection seems somewhat quirky, there may be an ulterior motive: Meinl Bank had a central role in the looting of Ukrainian banks during the 2014-2016 Biden administration of Ukraine. Image
Read 11 tweets
Mar 3
Valentyn Nalyvaichenko, named by NYT as architect of 2014 post-Maidan takeover of Ukrainian intelligence by CIA, is former head of Ukrainian SBU. His comments on Biden corruption deserve attention, but have been ignored.archive.is/zXXQV
on October 10, 2019, early in the Trump impeachment saga, Nalyvaichenko published an op ed in Wall St Journal saying "alliance with US depends on answering questions about Bidens and election interference" [by Ukraine] archive.is/wsrjP
Image
in that editorial, Naluvaichenko, the former SBU hear, stated that Ukraine had responsibility to investigate allegations that Ukraine interfered in 2016 election (a separate issue from Russian interference) and whether Burisma hired Hunter Biden for "cynical purposes". Image
Read 6 tweets
Mar 1
as Svetlana @RealSLokhova explained to us, intelligence fabricators (like Halper) begin by juxtaposing two targets in the same room and using that juxtaposition for their smear.

But, Weiss' Smirnov operation did exactly the opposite. I'll explain. twitter.com/search?lang=en…
Image
Smirnov had multiple Burisma contacts in 2017-Jan 2018, that are provable by email and travel records. See diagram below.
But, according to Weiss, instead of attaching narrative to provable meetings, Smirnov attached his narrative to non-existent contacts in 2015-16 and 2019. Image
Obvious question: why would Smirnov attach his narrative to fabricated meetings/telecons, when he had multiple real meetings/telecons to which he could have attached the narrative just as easily?
Read 7 tweets

Did Thread Reader help you today?

Support us! We are indie developers!


This site is made by just two indie developers on a laptop doing marketing, support and development! Read more about the story.

Become a Premium Member ($3/month or $30/year) and get exclusive features!

Become Premium

Don't want to be a Premium member but still want to support us?

Make a small donation by buying us coffee ($5) or help with server cost ($10)

Donate via Paypal

Or Donate anonymously using crypto!

Ethereum

0xfe58350B80634f60Fa6Dc149a72b4DFbc17D341E copy

Bitcoin

3ATGMxNzCUFzxpMCHL5sWSt4DVtS8UqXpi copy

Thank you for your support!

Follow Us!

:(