Revelle & Suess (1957) were among the first to estimate
CO₂ emissions from fossil fuels & used a UN energy demand forecast to estimate emissions out to 2000.
The forecast did surprising well until the 1970's oil crises...
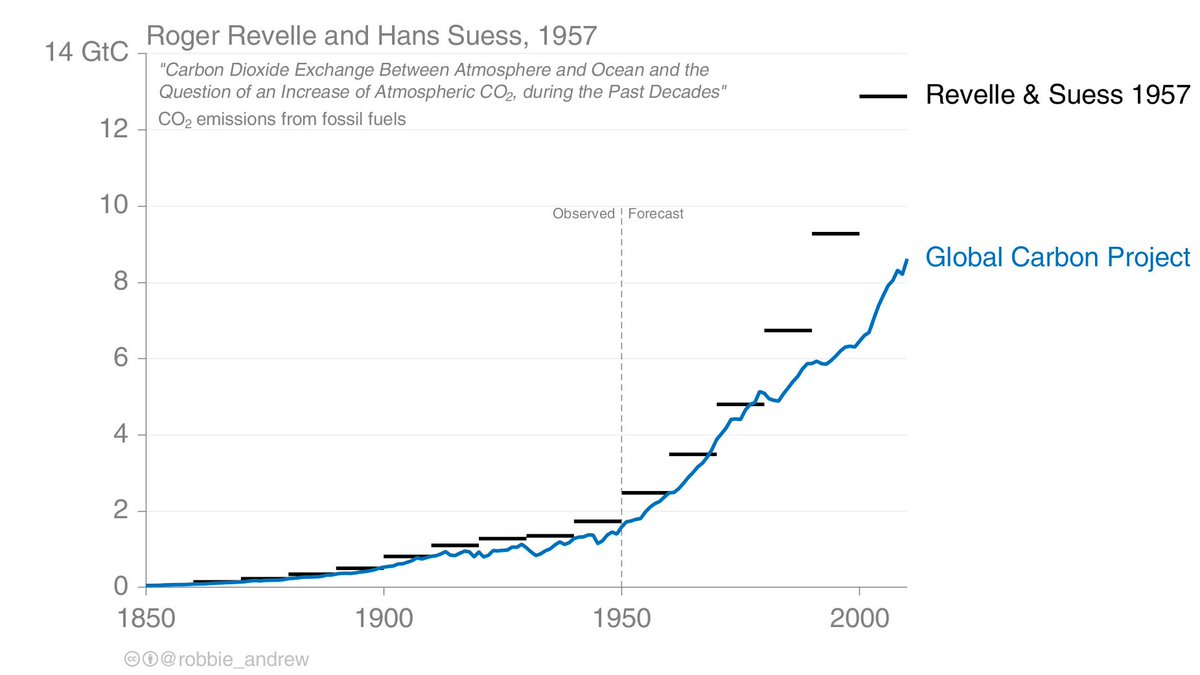
The divergence from the 1970's is interesting, as the oil crises spurred improvements in energy efficiency & nuclear power. It would be great to see the actual UN energy forecast by fuel type, and how it was made.
If anyone has access...
Full reference: World Energy Requirements. Proceedings of the International Conference on the Peaceful Uses of Atomic Energy, Vol 1, 1956 For [1950-62], United Nations, World Energy Supplies. Statistical papers, Series J, United Nations, New York.
(the conference was in 1955)
And I recommend you read this post from @robbie_andrew, as it is a great description of the early work done on estimating CO₂ emissions... folk.uio.no/roberan/t/Earl…
• • •
Missing some Tweet in this thread? You can try to
force a refresh
I am still pondering over 2023 & El Nino. Is 2023 an (unusual) outlier or not?
Looking at anomaly in 2023 relative to the trendline (loess 50 year window), without (left) & with (right) annualised ENSO lags, then 2023 is rather mundane.
1/
When looking at the temperature change relative to the previous year, without (left) & with (right) annualised ENSO lags, then 2023 is more unusual depending on the lag.
If 2023 is unusual, then it could be equally explained by 2022 being low (rather than 2023 being high).
2/
There are numerous ways to consider ENSO. I have used annualised indexes, & various lags can be included. It is also possible to take sub-annual indexes (eg, several months), & again, various lags.
What is statistically best? I presume there is a paper on this.
I started to take an interest in the 2023 temperature increase...
The first plot I did, to my surprise, seems to suggest that 2023 is not unusual at all (given El Nino).
Why?
1/
It all depends on how you slice the data. The previous figure was the anomaly relative to a trend (loess with 50 year window).
If I plot the change from the previous year (delta T), then 2023 is more unusual. Though, still, is it 2023 that is unusual, or 2022, or 2016, or?
2/
The loess trend changes shape with the data, making the 2023 anomaly smaller. It is also possible to use a linear trend, making the 2023 anomaly larger.
Comparing the anomaly to a linear trend will make 2023 more important (than if loess is used).
I am not so convinced. The land sink has a lot of variability, mainly due to El Nino, and an El Nino overlapped 2023. So we expect a lower land sink in 2023.
(My estimate assumes the ocean sink was average).
1/
Was 2023 an El Nino year? That is not so obvious...
How does one average the monthly sea surface data to an annual value El Nino index? How does one account for the lag between El Nino and the change in atmospheric CO2 growth?
There is no unique answer to this.
2/
This figure shows the monthly El Nino index annualised with different time lags. 2023 is an El Nino or La Nina, depending on how you average!
@richardabetts & @chrisd_jones use a 9 month lag in their work (which means 2023 was a La Nina)!
Record high emissions means record high radiative forcing.
We have you covered, we also include aerosols (SO2, etc) & have done so for decades. Also shipping!
Short-lived aerosols are important, but should not distract from the drivers of change: greenhouse gas emissions!
2/
Most of the energy put into the system ends in the ocean (90%), so the Ocean Heat Content (OHC) has been increasing along with emissions and radiative forcing.
This also means the Earth Energy Imbalance is also increasing.