Glen Peters Profile picture
Energy, emissions, & climate @CICERO_klima Projects @V_ERIFY_H2020, @4C_H2020, @ParisReinforce, @CoCO2_project, @iam_compact, @climatediamond, @EuPathfinder
Duncan Noble Profile picture Jean-Marc Desperrier Profile picture Pietro Monticone Profile picture Herve Moal Profile picture 💉💉💉💉💉😷😷😷😷 Warwick Tweedie Profile picture 21 subscribed
Jun 12 8 tweets 4 min read
Nitrous Oxide (N2O) is no laughing matter, atmospheric N2O has increased 25% due to human activities.

Today @gcarbonproject updates the Global Nitrous Oxide Budget, which helps us understand where the N2O comes from and where it goes.


1/ essd.copernicus.org/articles/16/25…
Image According to IPCC AR6, N2O caused 0.1°C of the current warming of 1.1°C (not this figure is now higher).

This may sound small, but since N2O is long-lived (like CO2) & primarily comes from agriculture, that 0.1°C will only go up in the future.

2/ Image
Jun 5 8 tweets 4 min read
Greenhouse gas emissions are at record highs, again.

The only good news is that Ozone Depleting Substances (ODS) regulating under the Montreal Protocol have declined substantially in the last decades.

But what does all this mean for climate?


1/ 🧵 essd.copernicus.org/articles/16/26…
Image 
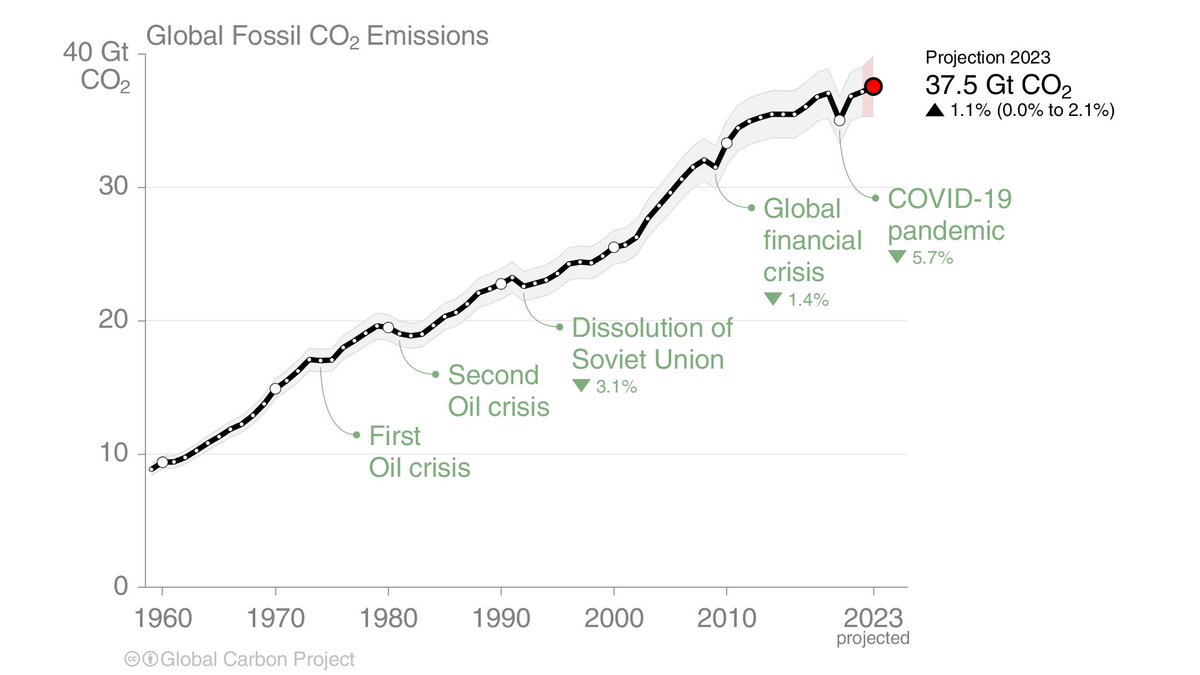
Record high emissions means record high radiative forcing.

We have you covered, we also include aerosols (SO2, etc) & have done so for decades. Also shipping!

Short-lived aerosols are important, but should not distract from the drivers of change: greenhouse gas emissions!

2/ Image
May 9 10 tweets 4 min read
"Implemented policies result in projected emissions that lead to warming of 3.2°C, with a range of 2.2°C to 3.5°C (medium confidence)"

According to the landmark, widely reported IPCC Synthesis Report published in 2023.


1/ ipcc.ch/report/ar6/syr/
Image 
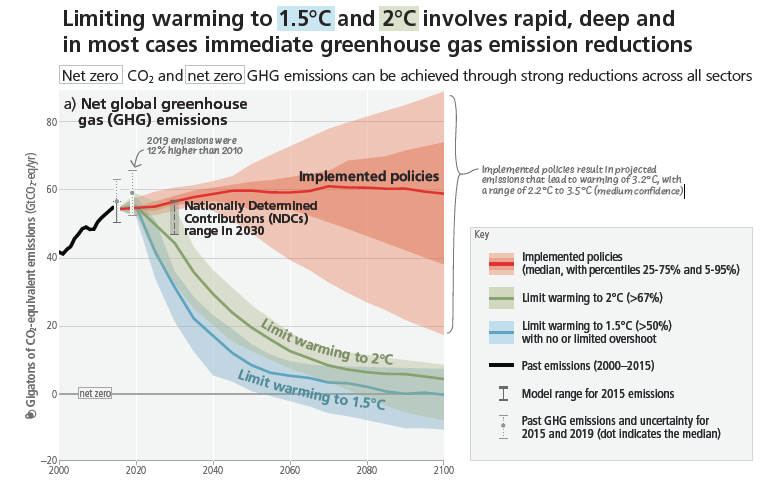
If you are surprised by this figure, where the median is 2.5°C (not 3.2°C), then I am curious why you think scientists are so optimistic...

The survey reflects more or less what scientists have been saying for years?


2/ theguardian.com/environment/ar…
Image
Apr 12 8 tweets 3 min read
There is a very strong linear relationship between atmospheric CO2 (concentration) and cumulative CO2 emissions.

In the last days, quite a few have been commenting there are feedbacks kicking in.

A thread...

1/ Image 
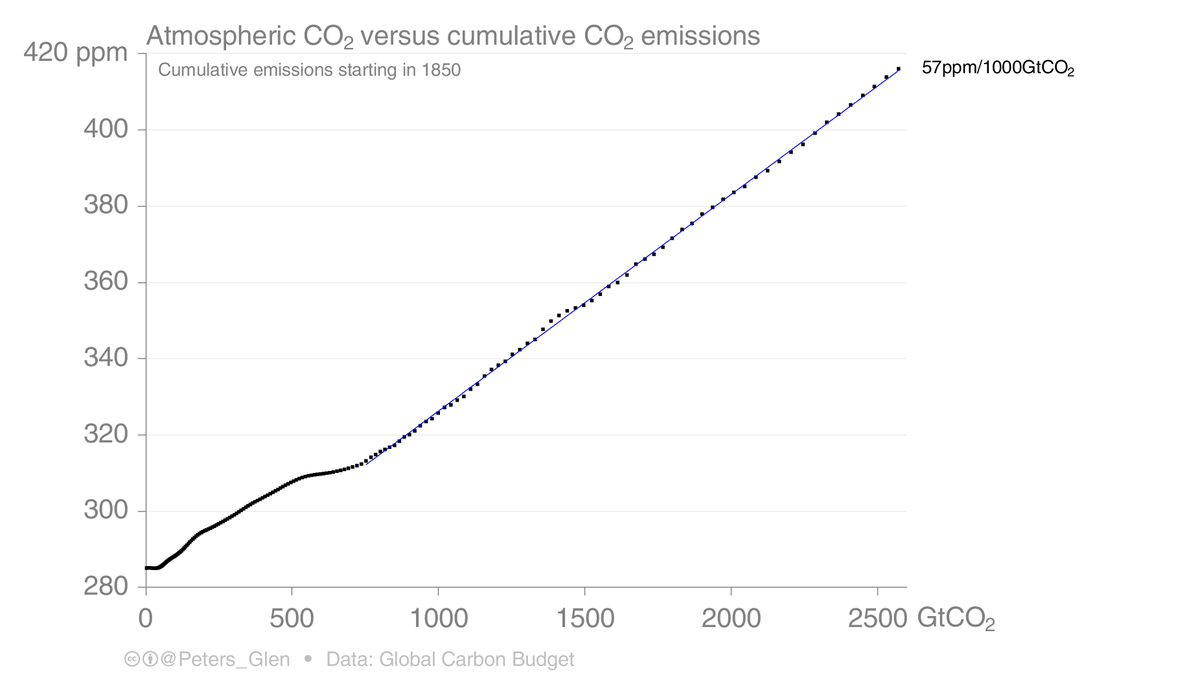
If atmospheric CO2 is proportional to cumulative CO2 emissions, then the annual change in atmospheric CO2 is proportional to annual CO2 emissions.

The ratio of the two is the 'airborne fraction', which is rather constant. Maybe a slight increase in trend lately, maybe...

2/ Image
Apr 9 8 tweets 5 min read
Is the atmospheric growth rate of CO2 slowing down?

Total CO2 emissions have gone from 2%/yr growth (2000s) to 0%/yr (2010s).

Do we see that change in the atmosphere?

It is hard to answer 🧵


1/ rdcu.be/buifD
Image I can make this figure incredibly complex by adjusting for ENSO (red dots and line).

We know the response of atmospheric CO2 to El Niño is lagged. This figure shows a 9 month lag, as used by Betts & Jones in their projection

But, 2023 is a La Niña?

2/ metoffice.gov.uk/research/clima…
Image
Dec 15, 2023 9 tweets 3 min read
One of the key arguments that Norway uses to continue oil & gas developments, is that under BAU it is expected that oil & gas production will decline in line with <2°C scenarios, even with continued investment.

Let's look closer at these projections & reality...

1/ Image 
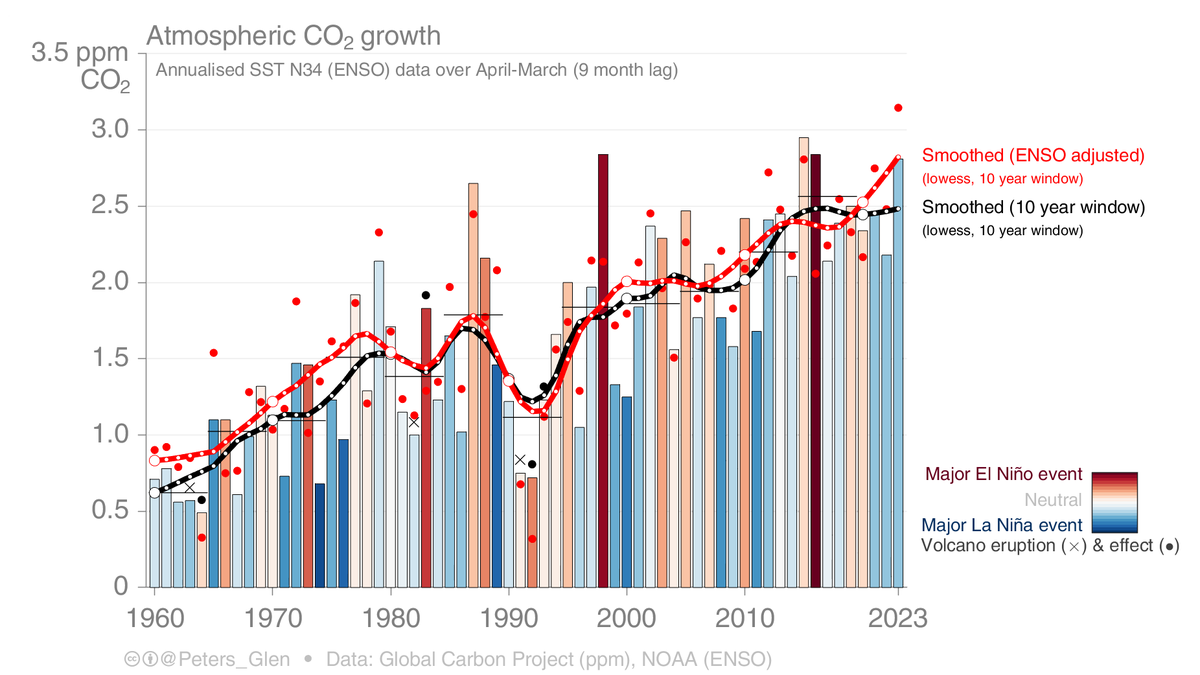
Here is the projections from the 2003 report from the petroleum agency.

In reality (tweet 1) there was a dip around 2010, but production is now up around 250 million cubic again.

The forecast was totally & utterly WRONG!

2/ Image
Dec 5, 2023 11 tweets 5 min read
📢Global Carbon Budget 2023📢

Despite record growth in clean energy, global fossil CO2 emissions are expected to grow 1.1% [0-2.1%] in 2023.

Strong policies are needed to ensure fossil fuels decline as clean energy grows!


1/ essd.copernicus.org/articles/15/53…
Image 
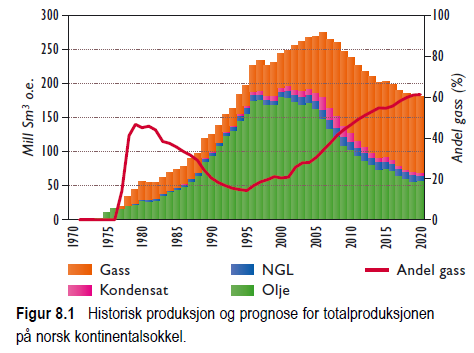
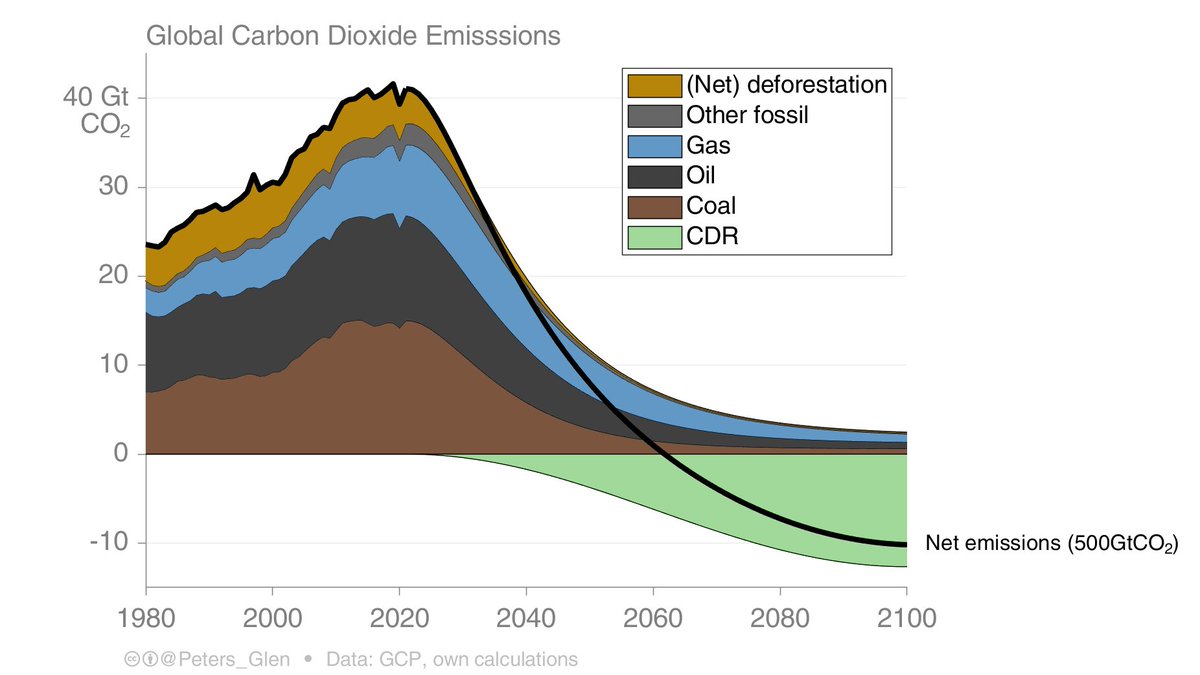
CO2 emissions by fossil fuel:
* We thought coal peaked in 2014. No, & up another 1.1% in 2023
* Oil up 1.5%, on the back of a 28% increase in international aviation & China, but oil remains below 2019 level. 🤞
* Has the golden age of gas come to an end thanks to Russia?

2/ Image
Nov 3, 2023 7 tweets 3 min read
Is the new @DrJamesEHansen et al article an outlier, or rather mainstream?

At least in terms of the key headline numbers, it seems rather mainstream, particularly if you remember most headline key numbers have quite some uncertainty!


🧵1/ academic.oup.com/oocc/article/3…
Image Equilibrium Climate Sensitivity of 4.8°C ± 1.2°C

IPCC best estimate 3°C
IPCC likely range: 2.5-4°C
IPCC very likely range: 2-5°C

Sure, Hansen et al are in the high end, but so are many others.

More details:

2/
Image
Oct 31, 2023 5 tweets 3 min read
The Remaining Carbon Budget for 1.5°C is now smaller because:
1) We have not reduced emissions in three years
2) Updated simple climate models because of updated historical aerosol emissions
3) Some new method choices


1/ nature.com/articles/s4155…
Image The update for 2°C has similar changes for each component, but because the budget is much bigger, the changes don't seem that dramatic. Not Nature Climate Change worthy...

The changes to the 1.5°C budget seem dramatic, because the budget is basically gone.

2/ Image
Sep 7, 2023 17 tweets 6 min read
ATTENTION

What is one of the most important decisions in climate science?

The selection of scenarios that will dominate climate research for the next 7+ years.

So, we wrote a perspective...

Here is the preprint:

1/ gmd.copernicus.org/preprints/gmd-…
Image To illustrate the importance, here is ScenarioMIP from CMIP6/AR6!

This is where SSP5-85 is chosen, & in fact, "considered the highest priority".

Where is SSP1-19, perhaps the most important scenario in climate policy? It was 'forced' in afterwards!


2/ gmd.copernicus.org/articles/9/346…
Image
Sep 6, 2023 10 tweets 4 min read
My father was born in 1921 & it warmed 1°C in his life, but his life improved immensely in 100 years.

The world is on track (currently) to warm another 1°C in 100 years, does that mean a kid born in 2021 will have (similar) improvements in life?

Bold thinking. But why?

1/ I think the first paragraph of Brian's article highlights a problem.

First, reference 6, @OurWorldInData does not support this statement, only the last phrase.

Second, our current modelling framework simply cannot answer the question, & is arguably unable to.

2/ Image
Aug 17, 2023 6 tweets 3 min read
To get to net zero CO2 emissions in 2050, the @IEA laid out a range of key milestones. There is so much work to do, in so many sectors. We know what to do.

There is also some Carbon Dioxide Removal. The IEA had ~2GtCO2 removed & stored, different to the 7.6GtCO2 'captured'.

1/ Image 
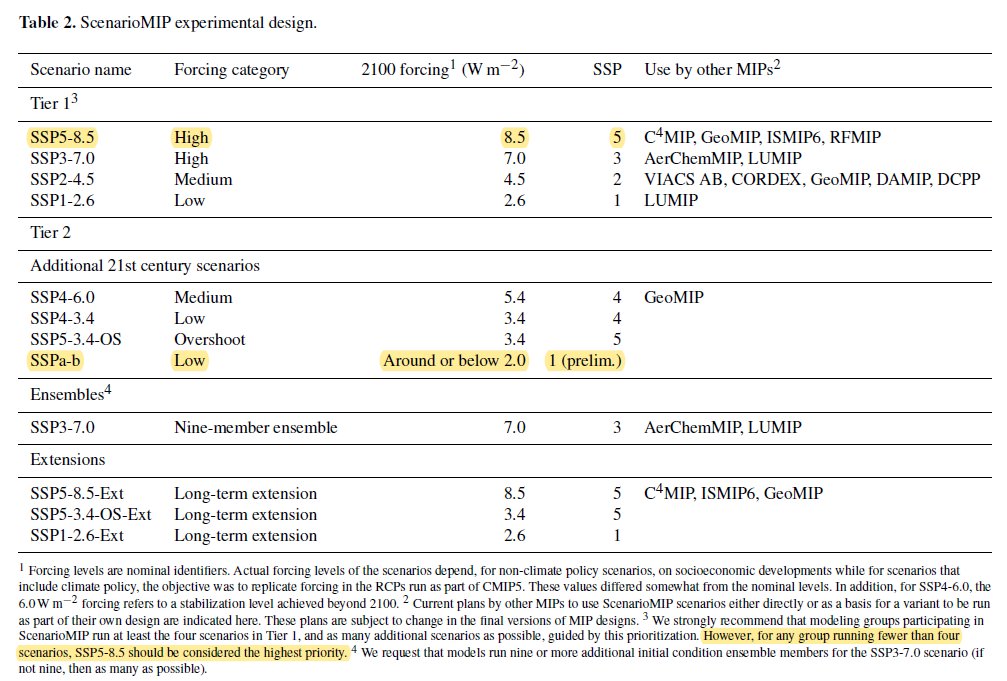
The IEA has key pillars:
* energy efficiency
* behaviour (yes, even the IEA)
* electrification
* renewables
* hydrogen
* bioenergy
* CCUS

An industry like steel will have measures in all these pillars.

2/ Image
May 9, 2023 4 tweets 2 min read
The scenarios assessed by the IPCC achieve short-term emission reductions (2020-2030) through ~75% decline in coal use. Oil & gas only have moderate declines between 2020 & 2030.

What are the equity implications?

1/ Image 
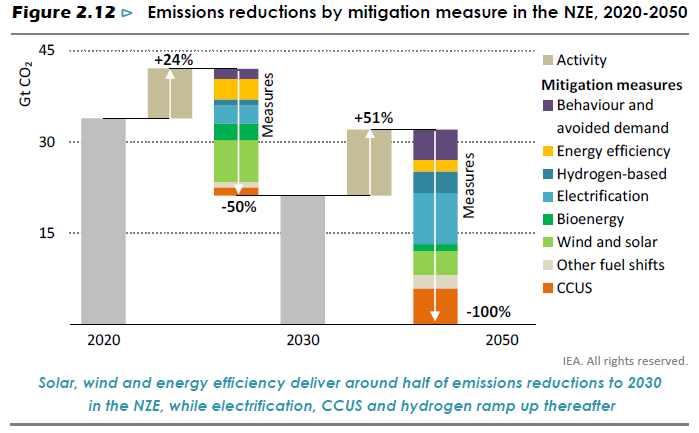
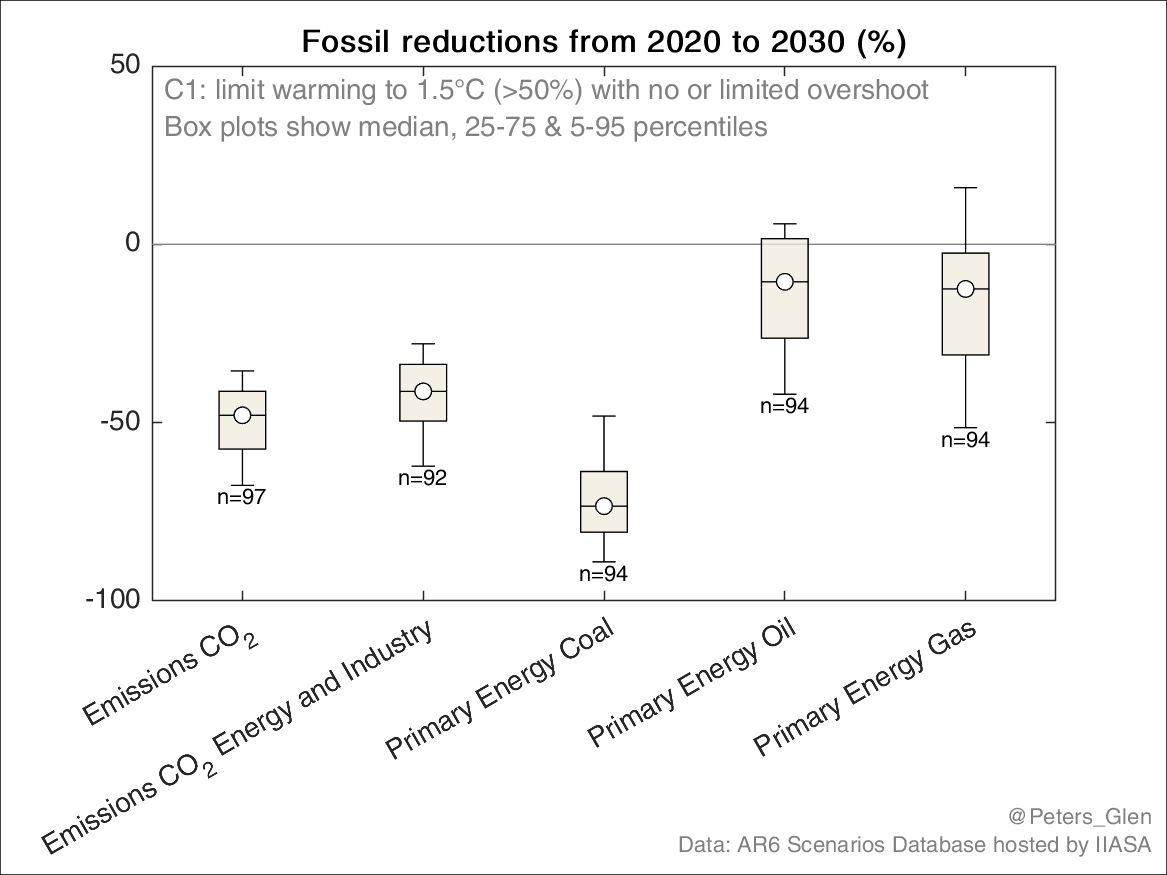
By 2050, basically all coal is gone (~100% reductions), and any coal that remains has CCS (not shown explicitly in the figure).

Oil & gas have only declined ~50% by 2050.

2/ Image
Apr 13, 2023 5 tweets 2 min read
I updated my 'stylised pathways' to 1.5°C figure to include coal, oil, & gas. Here is an example which shares the remaining budget 30:30:30:10 to coal, oil, gas, other.

In this presentation I play with those ratios a little bit:
linkedin.com/posts/glen-pet…

1/ Image 
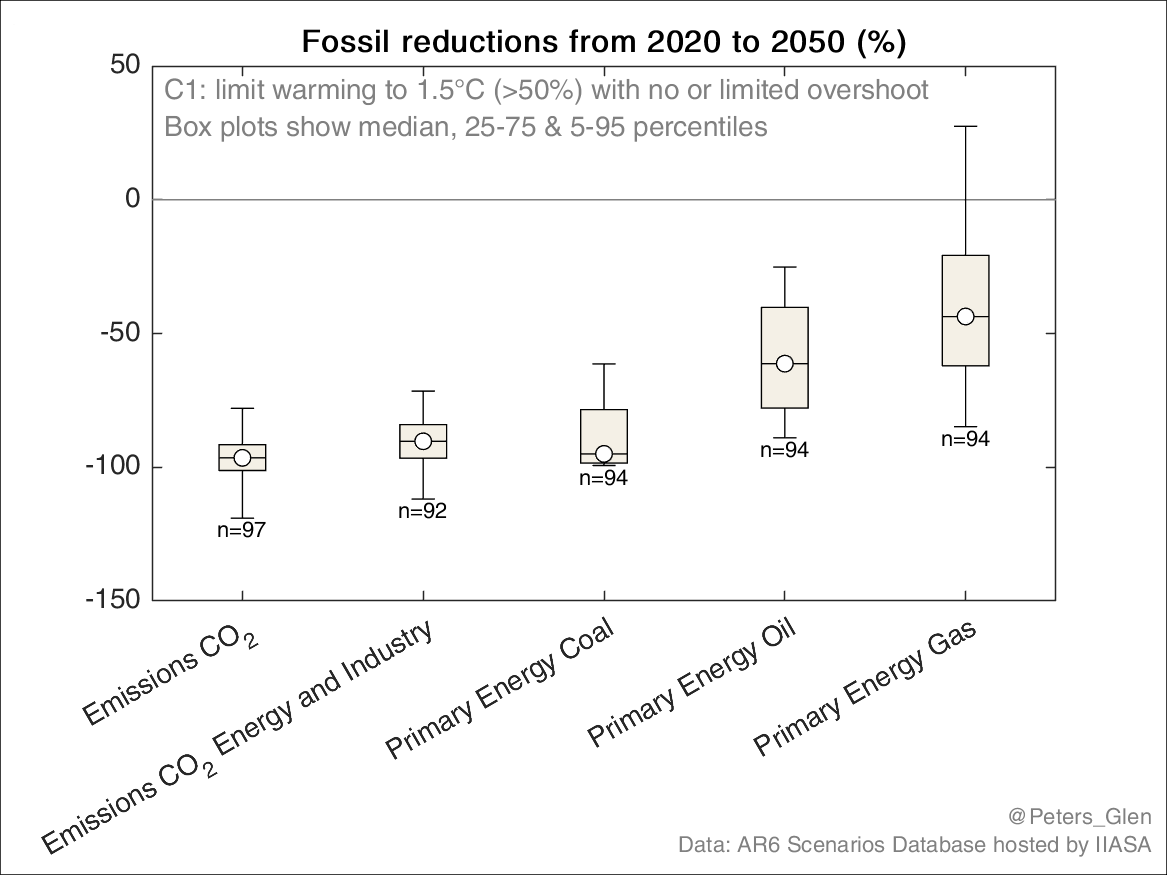
To make it easier to compare, this is what it looks like for each individual fossil fuel with those assumptions.

I have not calibrated these to scenarios from IAMs, but that is an obvious next step.

2/ Image
Apr 11, 2023 7 tweets 3 min read
I find the narrative "we need BOTH emission reductions AND carbon dioxide removal" increasingly problematic.

We need emission reductions. Full stop. Period. End of story.

Here is another attempt to show why emission reductions must come first & be prioritised.

1/ Image "But we need to invest in CDR now to get the necessary scale in 2050".

Sure, so invest if you must. But your investment is pointless unless emission reductions happen. So, if you want to get a payback from your investment, you need to make emission reductions happen.

2/ Image
Apr 5, 2023 6 tweets 2 min read
"Drastically reduce emissions first, or carbon dioxide removal will be next to useless" writes @_david_ho_

nature.com/articles/d4158…

1/
CDR is in addition to all the hard work reducing emissions from coal, oil, gas, cement, steel, etc. It is not instead of...

Yes, yes, you all know this. In fact, everyone knows this, but CDR has still captured everyone's imagination. Why? Because they don't know!

2/
Apr 3, 2023 5 tweets 2 min read
An update of my 'stylised pathways' figure showing the the implications of exhausting the remaining carbon budget without net negative CO₂ emissions (dark brown) compared to using overshoot (light brown).

The overshoot component is what we ask future generations to do...

1/ 
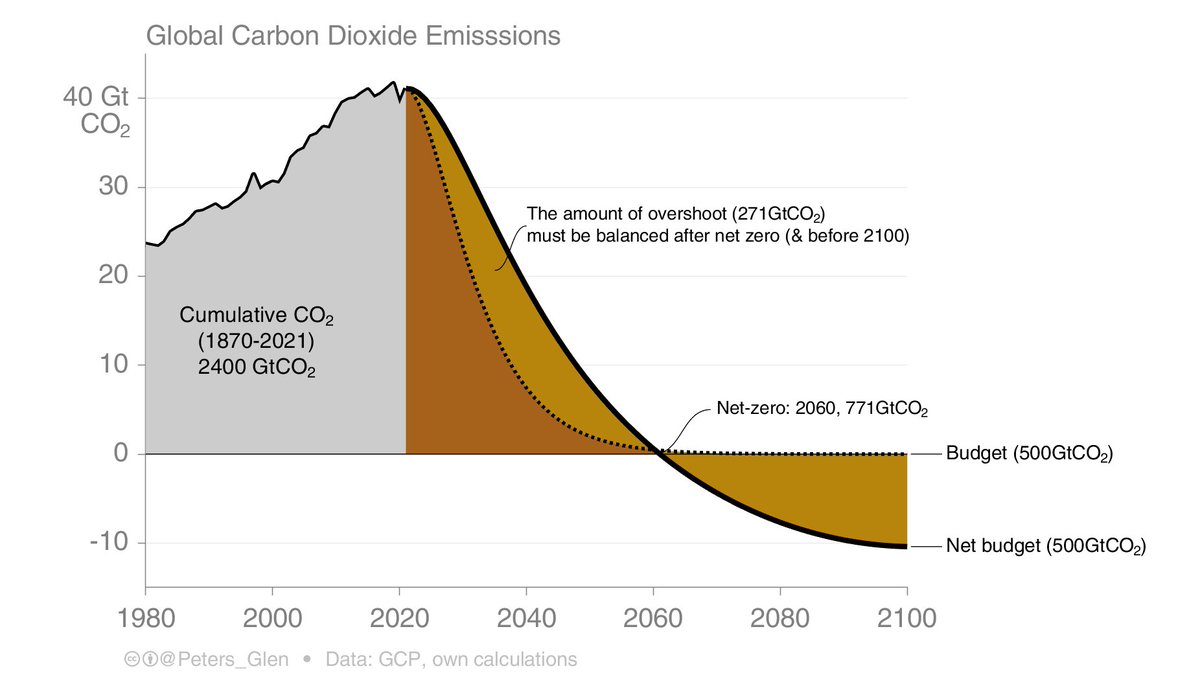
This particular configuration overshoots the remaining carbon budget by 270GtCO₂, which is about 0.12°C.

That small amount requires at least 270GtCO₂ carbon dioxide removal & likely more because of the need to counterbalance the 'hard-to-abate' emissions.

2/
Apr 3, 2023 7 tweets 2 min read
Does this just suggest the need for a new type of scenario?

Instead of backcasting & forcing models to 1.5°C, rather search the space for feasible* pathways in the <2°C space?

1/ * What is feasible? Who knows...

It is possible to explorer large parts of the scenario space by brute force agupubs.onlinelibrary.wiley.com/doi/full/10.10…
which may not be suitable to submit to the IPCC scenarios database...

2/
Apr 3, 2023 4 tweets 2 min read
The thing about getting papers published on 1 April is that people think they are just an April Fool's joke.

Well, whales & CDR have been discussed for a while. Some of our co-authors were initially skeptical:

Original paper: But, as @atrembath & @wang_seaver note: "be sure to look at the fine print"
thebreakthrough.org/issues/energy/…
Mar 30, 2023 6 tweets 4 min read
How much has each country contributed to global warming through historical GHG emissions (CO₂, CH₄, N₂O)?

China & US the most, Africa the least. (EU will be up there if all EU countries aggregated)

New paper led by @Jones_MattW nature.com/articles/s4159…

1/ You can see the EU impact over at @OurWorldInData, where @_HannahRitchie has included the data set in the CO₂ explorer!

Look at how fast China is growing...

ourworldindata.org/explorers/co2?…

2/
Mar 28, 2023 4 tweets 1 min read
Speaking of cheap Carbon Capture & Storage…

Equinor says it will cost 400-500€/tCO₂ to add CCS to their Melkøya LNG facility & they would rather electrify at 150€/tCO₂.

Researchers say the CCS should cost <100€/tCO₂🧐. What do IAMs say?

e24.no/energi-og-klim…

1/
The problem with electrification is that the community will not accept it, as it would double electricity demand in the region.

But, why is Equinor saying CCS is so expensive? Particularly since they are trying to champion it through Northern Lights & Net Zero plans?

2/