Glen Peters Profile picture
Aug 16, 2019 3 tweets 2 min read Read on X
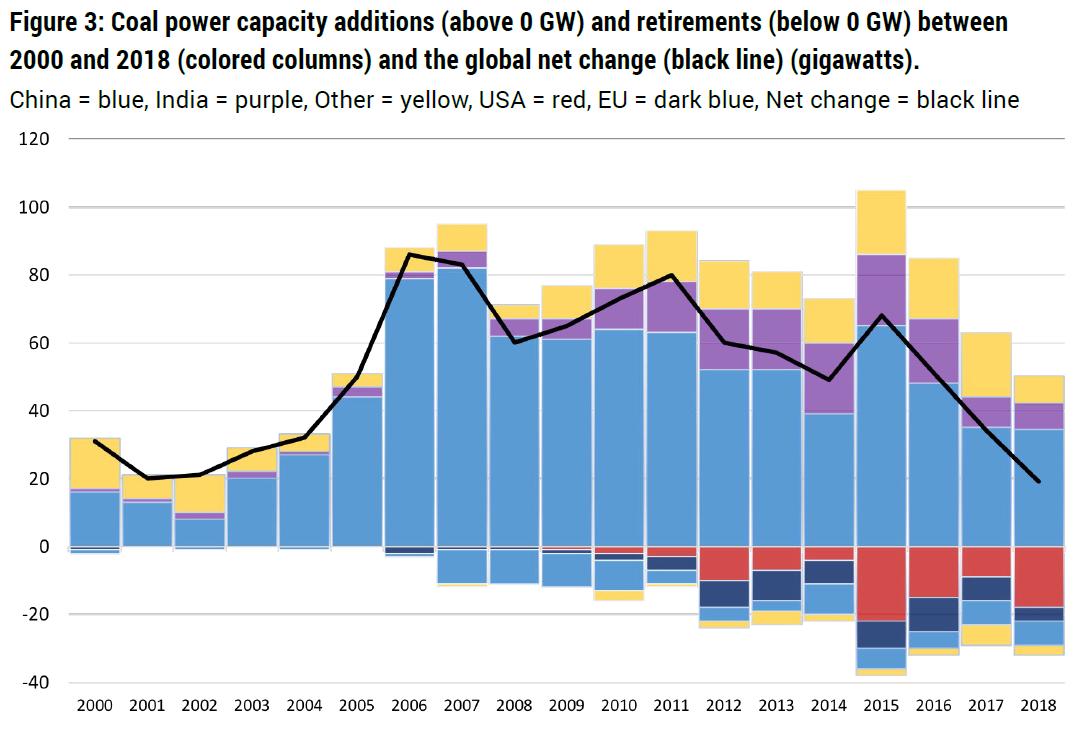
Globally, ~13GW of new coal capacity has been proposed so far in 2019, ~10GW has been retired. The global coal fleet may soon peak, but....

...but the coal fleet is big enough to blow 1.5°C!

1/

carbonbrief.org/guest-post-how…
endcoal.org/global-coal-pl…
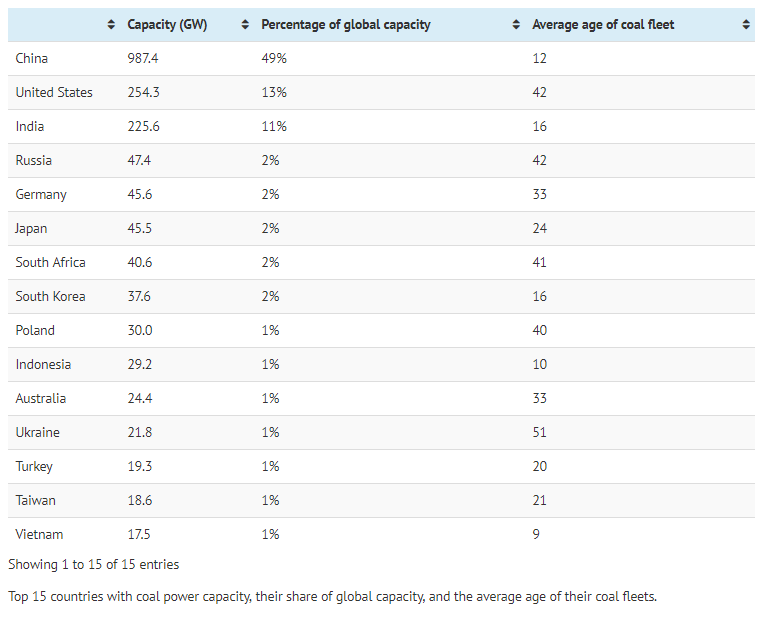
China, US, India have nearly 75% of the global coal fleet:
* China & India have young fleets, & are still expanding them, but at a slowing rate (blue/purple in previous tweet)
* US has an old fleet, & is leading the retirements (red in previous tweet)

2/
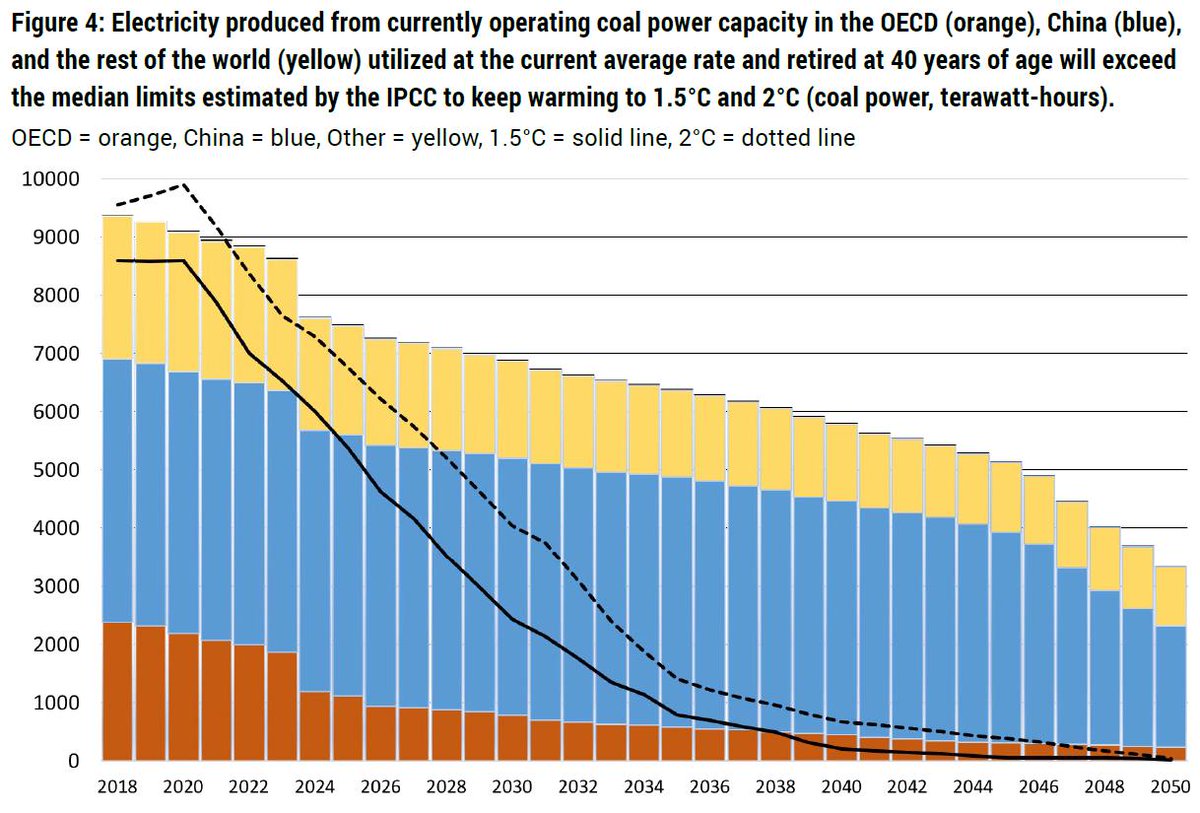
To keep within 1.5°C (& also below 2°C), the coal fleet will have to be retired early), or retrofitted with CCS.
* The aging OECD fleet is retiring (red)
* The coal challenge is in China, India, & the developing world.

Who is going to pay for China & India to retire coal?

3/3

• • •

Missing some Tweet in this thread? You can try to force a refresh
 

Keep Current with Glen Peters

Glen Peters Profile picture

Stay in touch and get notified when new unrolls are available from this author!

Read all threads

This Thread may be Removed Anytime!

PDF

Twitter may remove this content at anytime! Save it as PDF for later use!

Try unrolling a thread yourself!

how to unroll video
  1. Follow @ThreadReaderApp to mention us!

  2. From a Twitter thread mention us with a keyword "unroll"
@threadreaderapp unroll

Practice here first or read more on our help page!

More from @Peters_Glen

Sep 16
I am still pondering over 2023 & El Nino. Is 2023 an (unusual) outlier or not?

Looking at anomaly in 2023 relative to the trendline (loess 50 year window), without (left) & with (right) annualised ENSO lags, then 2023 is rather mundane.

1/
Image
Image
When looking at the temperature change relative to the previous year, without (left) & with (right) annualised ENSO lags, then 2023 is more unusual depending on the lag.

If 2023 is unusual, then it could be equally explained by 2022 being low (rather than 2023 being high).

2/
Image
Image
There are numerous ways to consider ENSO. I have used annualised indexes, & various lags can be included. It is also possible to take sub-annual indexes (eg, several months), & again, various lags.

What is statistically best? I presume there is a paper on this.

3/ Image
Read 5 tweets
Sep 13
I started to take an interest in the 2023 temperature increase...

The first plot I did, to my surprise, seems to suggest that 2023 is not unusual at all (given El Nino).

Why?

1/ Image
It all depends on how you slice the data. The previous figure was the anomaly relative to a trend (loess with 50 year window).

If I plot the change from the previous year (delta T), then 2023 is more unusual. Though, still, is it 2023 that is unusual, or 2022, or 2016, or?

2/ Image
The loess trend changes shape with the data, making the 2023 anomaly smaller. It is also possible to use a linear trend, making the 2023 anomaly larger.

Comparing the anomaly to a linear trend will make 2023 more important (than if loess is used).

3/ Image
Read 7 tweets
Aug 6
Has the land sink collapsed in 2023?

I am not so convinced. The land sink has a lot of variability, mainly due to El Nino, and an El Nino overlapped 2023. So we expect a lower land sink in 2023.

(My estimate assumes the ocean sink was average).

1/ Image
Was 2023 an El Nino year? That is not so obvious...

How does one average the monthly sea surface data to an annual value El Nino index? How does one account for the lag between El Nino and the change in atmospheric CO2 growth?

There is no unique answer to this.

2/ Image
This figure shows the monthly El Nino index annualised with different time lags. 2023 is an El Nino or La Nina, depending on how you average!

@richardabetts & @chrisd_jones use a 9 month lag in their work (which means 2023 was a La Nina)!


3/ metoffice.gov.uk/research/clima…
Image
Read 10 tweets
Jun 12
Nitrous Oxide (N2O) is no laughing matter, atmospheric N2O has increased 25% due to human activities.

Today @gcarbonproject updates the Global Nitrous Oxide Budget, which helps us understand where the N2O comes from and where it goes.


1/ essd.copernicus.org/articles/16/25…
Image
According to IPCC AR6, N2O caused 0.1°C of the current warming of 1.1°C (not this figure is now higher).

This may sound small, but since N2O is long-lived (like CO2) & primarily comes from agriculture, that 0.1°C will only go up in the future.

2/ Image
There are many sources of N2O, over half of which are natural (soils).

Anthropogenic sources are dominated by agriculture (soils & manure management) & industry (chemicals).

The sink is due to photolysis & oxidation in the atmosphere.

3/ Image
Read 8 tweets
Jun 5
Greenhouse gas emissions are at record highs, again.

The only good news is that Ozone Depleting Substances (ODS) regulating under the Montreal Protocol have declined substantially in the last decades.

But what does all this mean for climate?


1/ 🧵 essd.copernicus.org/articles/16/26…
Image
Record high emissions means record high radiative forcing.

We have you covered, we also include aerosols (SO2, etc) & have done so for decades. Also shipping!

Short-lived aerosols are important, but should not distract from the drivers of change: greenhouse gas emissions!

2/ Image
Most of the energy put into the system ends in the ocean (90%), so the Ocean Heat Content (OHC) has been increasing along with emissions and radiative forcing.

This also means the Earth Energy Imbalance is also increasing.

3/ Image
Read 8 tweets
May 9
"Implemented policies result in projected emissions that lead to warming of 3.2°C, with a range of 2.2°C to 3.5°C (medium confidence)"

According to the landmark, widely reported IPCC Synthesis Report published in 2023.


1/ ipcc.ch/report/ar6/syr/
Image
If you are surprised by this figure, where the median is 2.5°C (not 3.2°C), then I am curious why you think scientists are so optimistic...

The survey reflects more or less what scientists have been saying for years?


2/ theguardian.com/environment/ar…
Image
This question is ambiguous: "How high above pre-industrial levels do you think average global temperature will rise between now and 2100?"
* ...pre-industrial... between "now and 2100"?
* Where we are currently heading or where we could head? This is largely a policy question?
3/
Read 10 tweets

Did Thread Reader help you today?

Support us! We are indie developers!


This site is made by just two indie developers on a laptop doing marketing, support and development! Read more about the story.

Become a Premium Member ($3/month or $30/year) and get exclusive features!

Become Premium

Don't want to be a Premium member but still want to support us?

Make a small donation by buying us coffee ($5) or help with server cost ($10)

Donate via Paypal

Or Donate anonymously using crypto!

Ethereum

0xfe58350B80634f60Fa6Dc149a72b4DFbc17D341E copy

Bitcoin

3ATGMxNzCUFzxpMCHL5sWSt4DVtS8UqXpi copy

Thank you for your support!

Follow Us!

:(