Charles Franklin Profile picture
Aug 20, 2019 14 tweets 5 min read Read on X
A few fractures in the base; or partisan asymmetry in evaluations of the president. 1/14
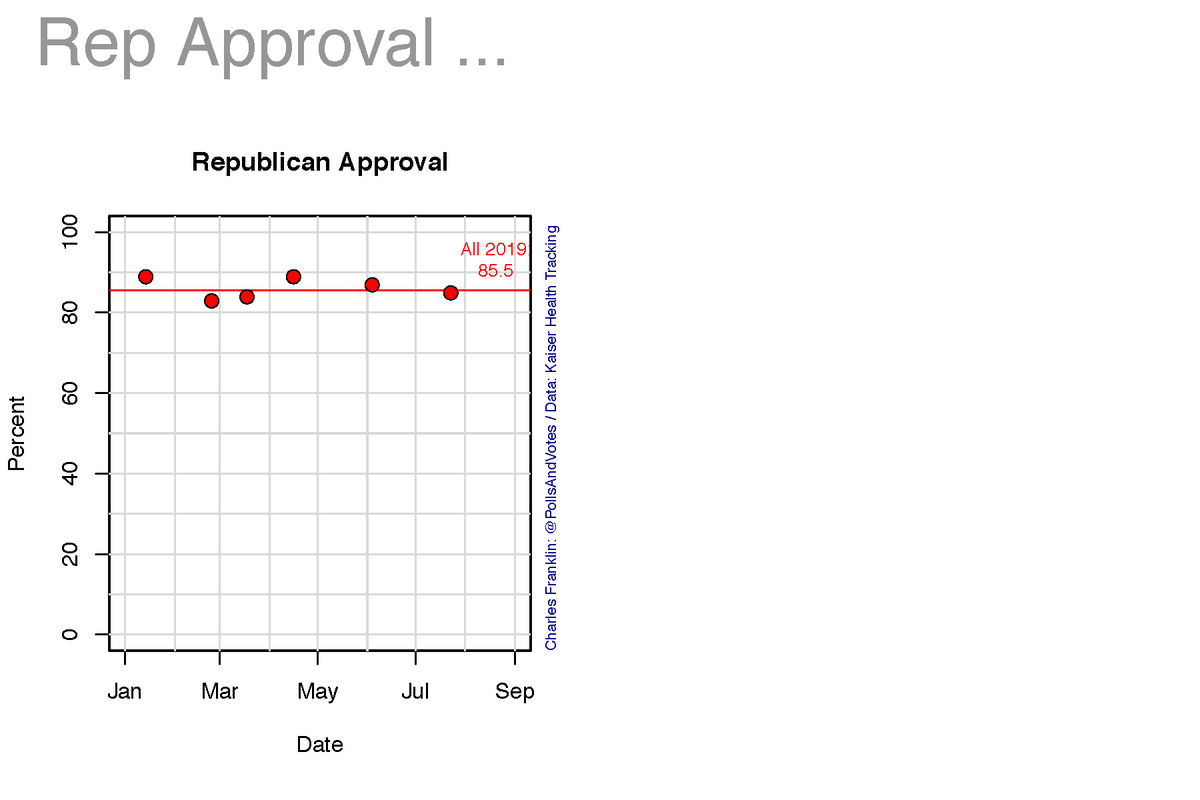
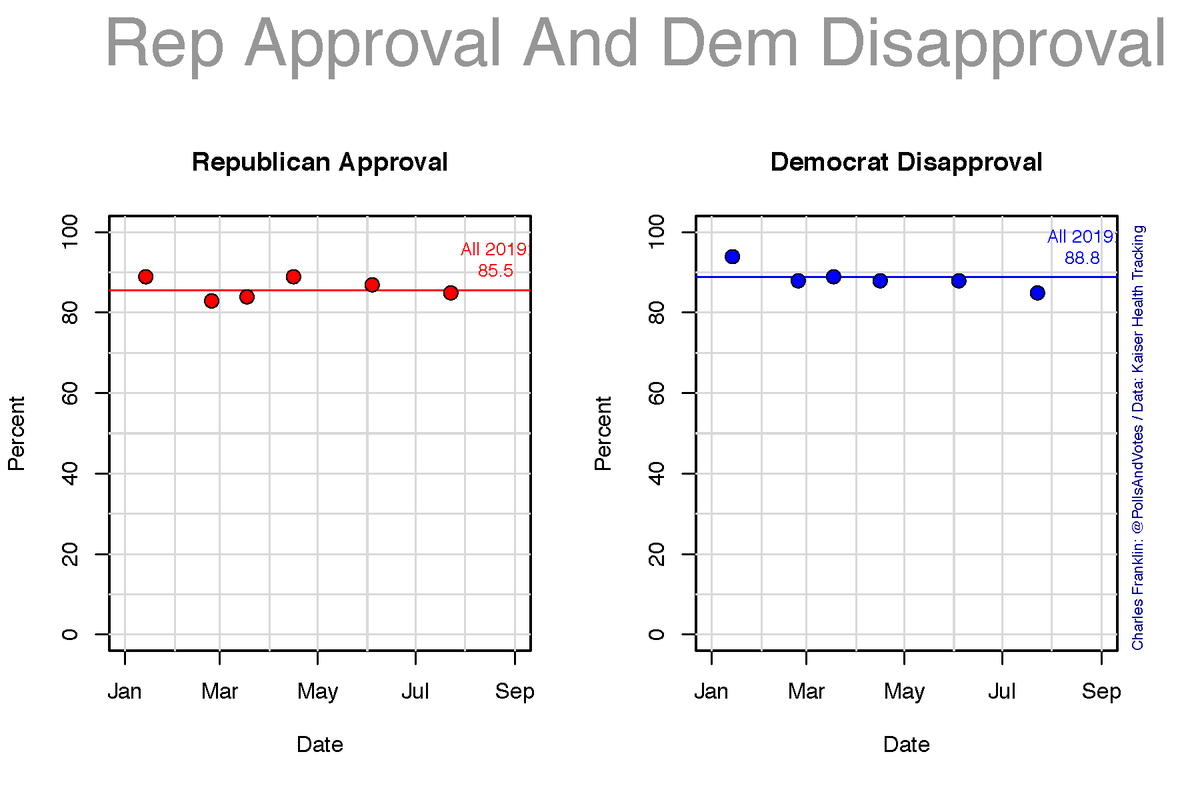
For most of his presidency Trump has enjoyed approval among Republicans in the high 80 percent range. This has been much remarked upon. In Kaiser (@KFF) Health Tracking polls this year (January-April, June-July), Rep approval has been 89, 83, 84, 89, 87 and 85% (no May poll) 2/
@KFF These are impressive numbers. But consider the DISapproval among Democrats for the same period: 94, 88, 89, 88, 88 and 85. Two parties get to play the game, and Democrats disapprove of Trump as much as Republicans approve. 3/
If that were the full story, polarization reigns and the parties are symmetric in their devotion or disgust. All normal. But that isn't the full story. 4/
Approval is usually dichotomized but is often measured in four points-strongly approve, somewhat approve, somewhat disapprove & strongly disapprove. If we consider strength, the story is more complicated. The parties are NOT symmetric in strong approval vs strong disapproval. 5/
Among Republicans in 2019, 65% strongly approved of Trump's handing of his presidency. But among Democrats 80% strongly disapproved. If strength of opinion is motivating, say for turnout in 2020, advantage Dems. 6/
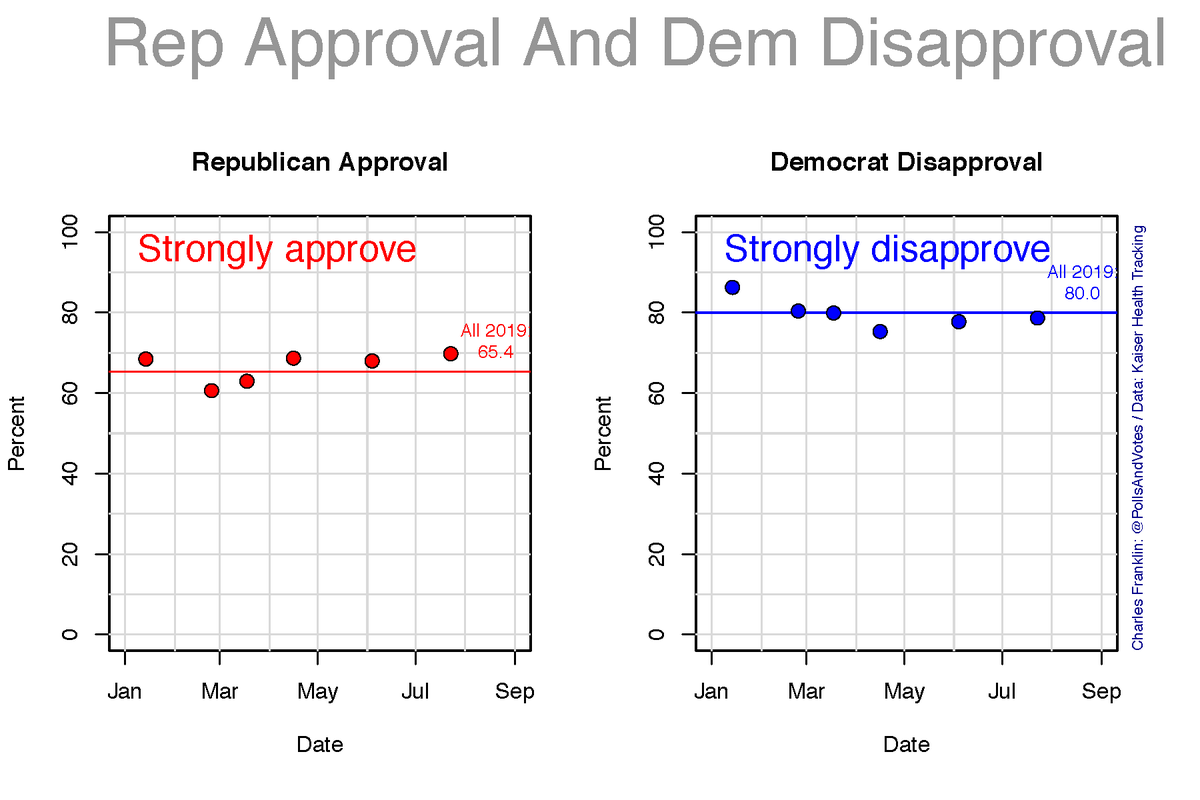
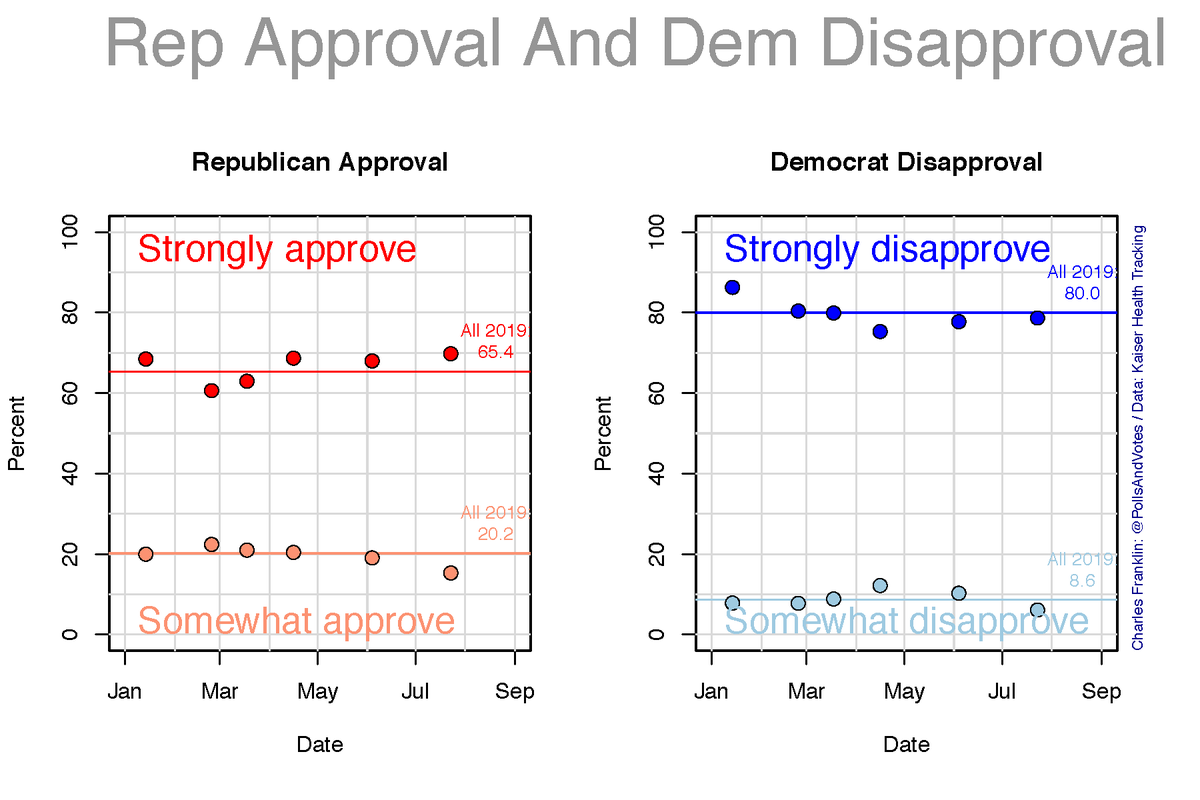
For Republicans, the 65% strong approval was paired with 20% who somewhat approved. That oft cited 85% total approval is a bit fractured. For Dems, 80% strongly disapproved and just 9% somewhat disapproved. Rather unified. 7/
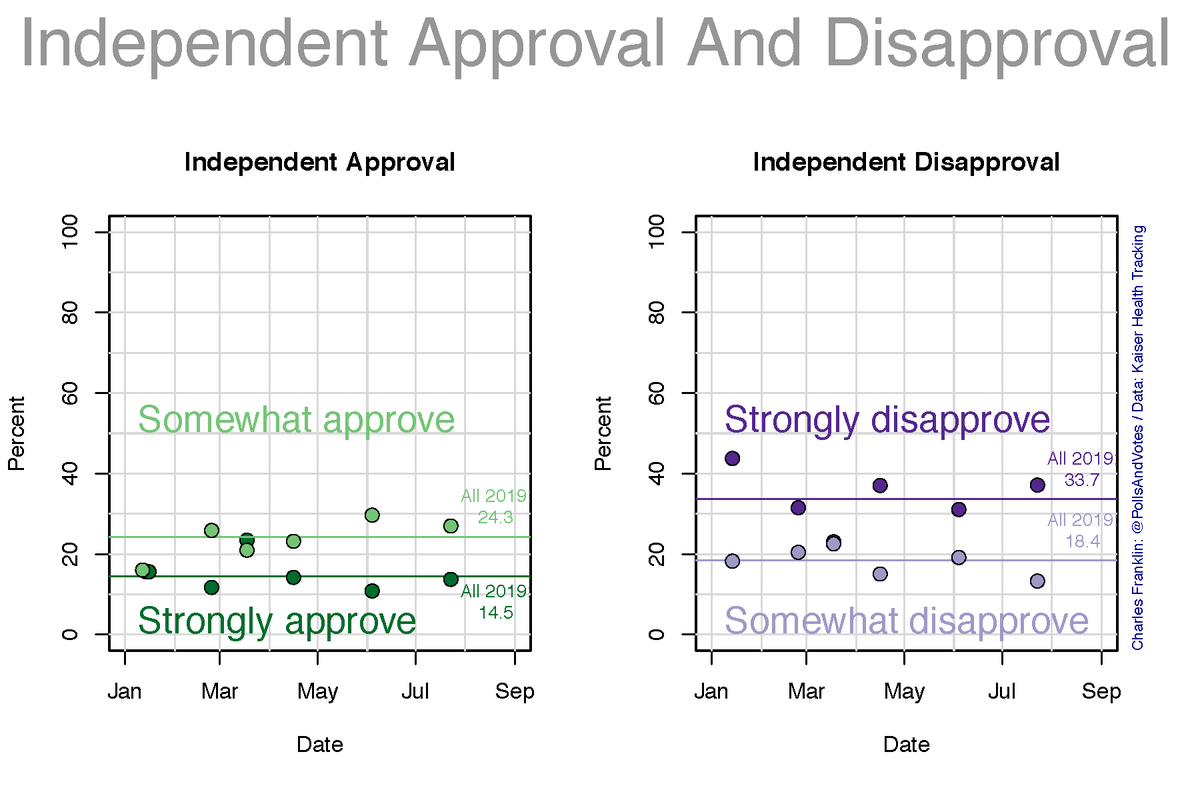
We might mention independents as well. In 2019 39% approved, 52% disapproved, but again strength mattered among Independents: 15% strong approval, 34% strongly disapprove. And 24% somewhat approve vs 18% somewhat disapprove. 8/
Partisanship also varies in strength. (Pooling all 2019 data.) Compare partisans with independents who lean to a party. Again there is asymmetry. 65% of Reps strongly approve vs 80% of Dems who strongly disapprove. And ... 9/
Among Rep leaners 42% strongly approve and 33% somewhat approve. For Dem leaners: 72% strongly disapprove and 16% somewhat disapprove. 10/
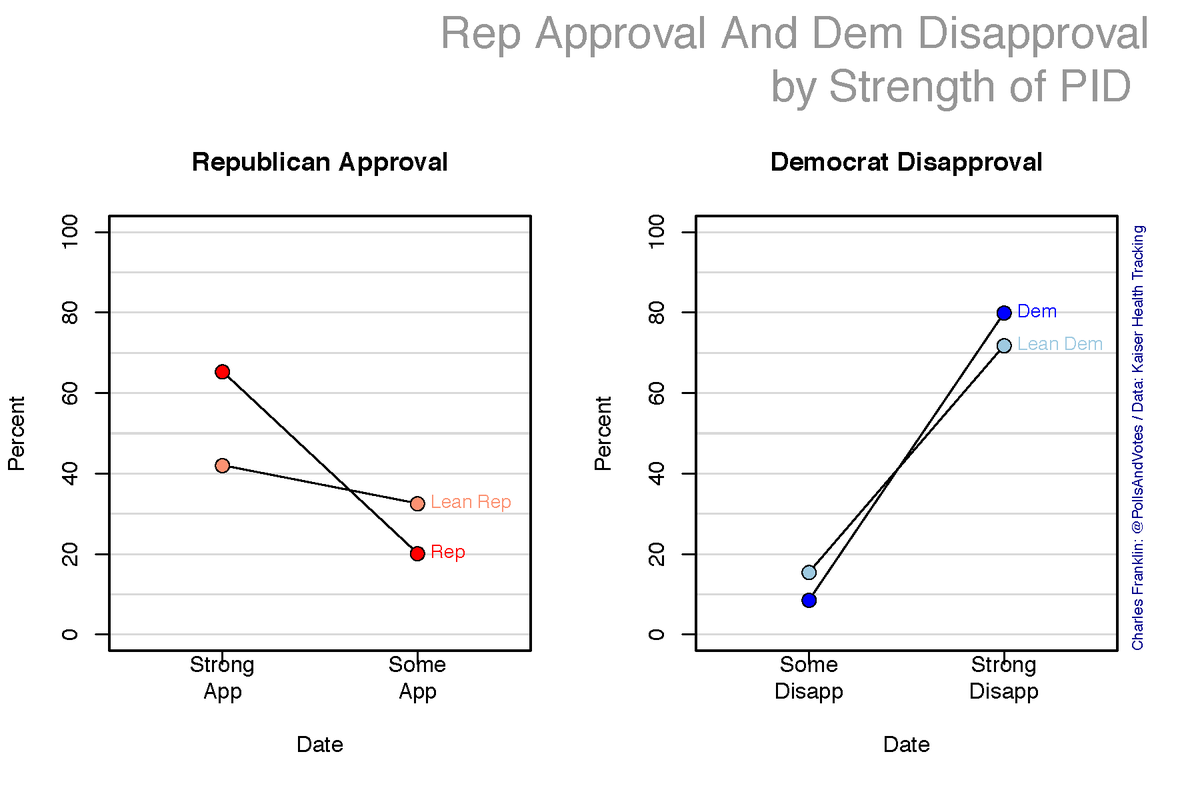
Strong approval is 23 points higher among Reps than among Rep leaners. For Dems the gap is modest, 80% of Dems strongly disapprove and 72% of Dem leaners agree, just an 8 point difference. 11/
While Reps are over 85% approving of the president, the ratio of strong-to-some approval is just over 3 to 1. Among Dems, the ratio of strong-to-some DISapproval is 8 to 1. 12/
It seems likely that GOP voters, either partisans or leaners, will find reasons to come home to Trump against a specific Democratic opponent. But there is more need for Republicans to develop a common view of Trump than there is for Dems to unite in opposition. 13/
There are strengths and weaknesses for both parties heading into 2020. But one of the most often cited Trump strengths, an approval with his base Republicans in the high 80s, has some fractures. 14/14

• • •

Missing some Tweet in this thread? You can try to force a refresh
 

Keep Current with Charles Franklin

Charles Franklin Profile picture

Stay in touch and get notified when new unrolls are available from this author!

Read all threads

This Thread may be Removed Anytime!

PDF

Twitter may remove this content at anytime! Save it as PDF for later use!

Try unrolling a thread yourself!

how to unroll video
  1. Follow @ThreadReaderApp to mention us!

  2. From a Twitter thread mention us with a keyword "unroll"
@threadreaderapp unroll

Practice here first or read more on our help page!

More from @PollsAndVotes

Aug 31, 2023
The indictments of Donald Trump have *not* boosted him in the polls, either for favorability or for his support in the GOP primary. This claim keeps being repeated as if the data support it. It does not.

pollsandvotes.com/?p=455
Trump’s net favorability inched up 1.5-2 points following the first indictment in New York on March 30, 2023, from a median of -14.0 to -12.5, and mean of -14.2 to -12.2. This is the only period of a (slight) improvement compared to the pre-indictment period Image
Compared to pre-indictment, Trump did have higher support among Republicans in the primary vote following the New York indictment, a median of 49% prior to the NY indictment and 57% after NY but before Florida. There was no further change after Florida or after DC & now 58% But.. Image
Read 6 tweets
Dec 1, 2022
Our new national @MULawPoll is out

DeSantis gains support, now moving up to a tie with Biden among registered voters nationwide. His support has slowly but steadily increased over the year. Biden has remained stable. 15% wish for an alternative to these two. 1/n Image
Trump continues to trail Biden, by 10 points in this poll. Biden lead has been increasing since March. DeSantis was a point stronger than Trump vs Biden in March & Sept, but now 10 points stronger on margin vs Biden. 2/n Image
Support for a Trump 2024 bid among Republican registered voters is down, though still at a 55% majority. It was 64% in July. 3/n Image
Read 12 tweets
Nov 12, 2022
Wisconsin density and vote, the journey continues

Density is concentrated in the southeast, with other denser places in St. Croix-Eau Claire area, plus pockets like La Crosse

Pop change since 2010 varies & modestly correlated .28 w density

I focus on density. You do change 1/n
Do note the places with pop declines though. Milwaukee is important for decline in pop, and as notes may account for decline in total vote in 2022.

But also note what a massive growth Dane County accounts for. Fox valley, St. Croix-Eau Claire too. 2/n
Here is Senate vote margin and change in Senate margin by pop density.

Margin is correlated but not overwhelmingly. But change in margin is much more strongly related to density. We saw this in previous thread, but a different look here, explicitly vs density. 3/n
Read 8 tweets
Nov 12, 2022
More on Wisconsin turnout.

Where turnout rose from 2018 to 2022, GOP did better, Dem did worse.

Turnout change was a net benefit to Johnson & Michels.

Much attention to Milwaukee County, where turnout was down 47,090 from 2018. How much did that matter in Senate race? 1/n Image
Barnes won MKE county by 40.26%, so if turnout had remained at 2018 level, and Barnes got the same share of those additional votes, he would have picked up 18,959 net votes

Statewide, he lost by 27,407

The MKE turnout would have tightened the race, but not put Barnes ahead 2/n Image
But you don't get to raise turnout only in your best places. Some counties with lower turnout favored Johnson. Likewise, the counties the increased turnout mostly favored Johnson.

So what if turnout in ALL counties had equaled 2018 turnout while splitting vote as in 2022? 3/n
Read 4 tweets
Nov 12, 2022
Friday night of election week, so more data, of course.

The Wisconsin elections in 5 maps and 2 charts.

First up: Vote margins in Senate and Governor races by county.

Evers wins or comes close in a few more counties than Barnes does in Senate.

Dane is *dark* blue.

1/n
Now look at shifts since the 2016 Senate and 2018 Gov races.

The southeast and Fox valley are mostly red in the vote margin, but are moving in a Dem direction in both races. BOW and WOW. <;-)

North & West redder, but especially for Senate, less for Gov.

Geo polarization.

2/n
Now compare the votes for Senate in 2022 vs 2016.

The BIG story is look at the counties below the diagonal. Most are the big counties, and that includes BOW, WOW and M&M (Madison & Milwaukee)

Above diagonal, almost all small counties.

DENSITY DIVIDE.

3/n
Read 5 tweets
Oct 21, 2022
Fundamentals thread

The current conventional wisdom is for the midterm to be somewhat better than average for the president's party in the House. (I set aside the Senate here.) The fundamentals doubt that, as we'll see. 1/n
The "fundamentals" provide a helpful baseline, even if "non-fundamentals" such as polling, candidate quality, unique issues, may modify that baseline. So let's only look at historical relationships here. 2/n
The starting point is that Democrats currently hold 220 seats in the House, Republicans have 212 and 3 seats are vacant. 218 seats are the minimal majority with no vacancies. 2 of the vacancies were held by Democrats, 1 by a Republican, so call it 222-113 now. 3/n
Read 17 tweets

Did Thread Reader help you today?

Support us! We are indie developers!


This site is made by just two indie developers on a laptop doing marketing, support and development! Read more about the story.

Become a Premium Member ($3/month or $30/year) and get exclusive features!

Become Premium

Don't want to be a Premium member but still want to support us?

Make a small donation by buying us coffee ($5) or help with server cost ($10)

Donate via Paypal

Or Donate anonymously using crypto!

Ethereum

0xfe58350B80634f60Fa6Dc149a72b4DFbc17D341E copy

Bitcoin

3ATGMxNzCUFzxpMCHL5sWSt4DVtS8UqXpi copy

Thank you for your support!

Follow Us!

:(