Madeleine Sumption Profile picture
Aug 21, 2019 10 tweets 4 min read Read on X
Important report today for @ONS provides revised figures for EU and non-EU net migration since 2009. Here's my take on what the key points are. ons.gov.uk/peoplepopulati… @MigObs

/THREAD/
It has been clear for some time that something wasn't quite right in the net migration stats. Non-EU net migration looked higher than expected and EU net migration looked lower, when you compare it to other data sources, such as the Annual Population Survey (APS) - see chart
There are various reasons this could be (e.g. different definitions used in different sources, migrants' uncertainty about whether they're migrating long-term) and @ONS has been working to understand exactly what's going on. The biggest step in that work comes in today's report.
They've drawn on some new data sources e.g. DWP data to get a better picture. And they concluded that the previous estimates were systematically underestimating EU net migration and overestimating non-EU net migration.
Exactly how much the official figures have underestimated EU net migration is not yet known. But this initial set of adjusted figures increase the estimate of EU net migration by 16% or 29,000 for the year ending March 2016, the most recent period for which adjustment possible.
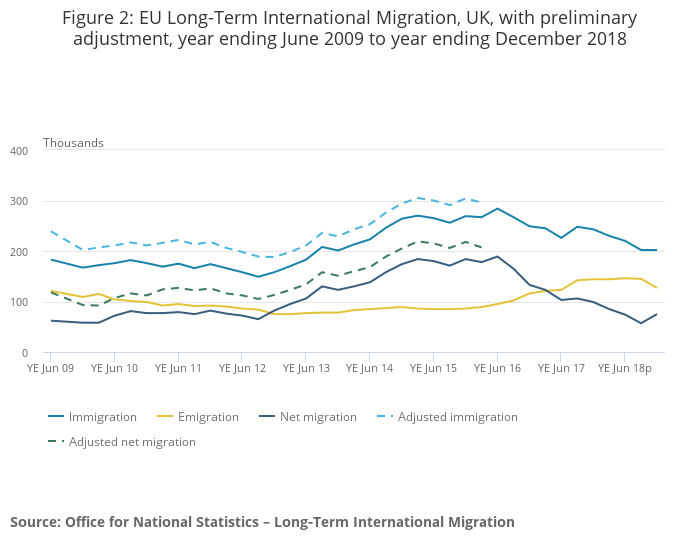
The underestimate of EU net migration was mostly due to immigration from EU8 countries such as Poland. @ONS think this is probably because these migrants are often particularly uncertain about how long they're coming for, so might not be counted as 'long-term' migrants.
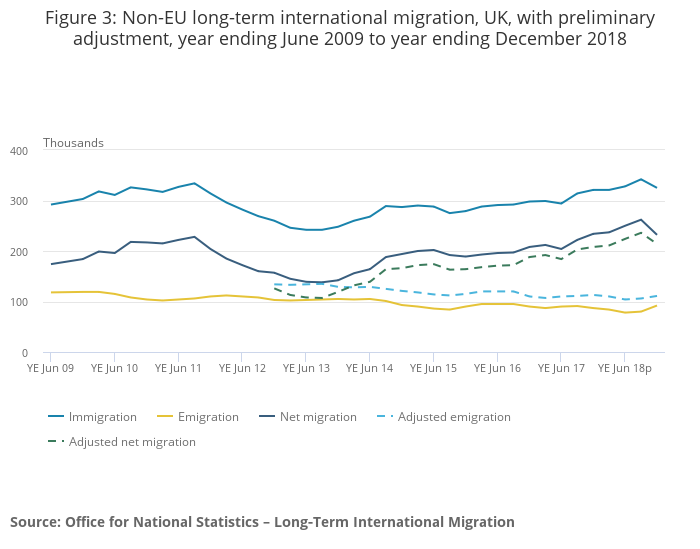
ONS has also concluded estimates of non-EU net migration have been too high, due to undercount of emigration of non-EU students. Adjusted figures non-EU net migration are 13% (or 25,000) lower than previous estimates in the year ending March 2016, and 8% or 18,000 lower for 2018.
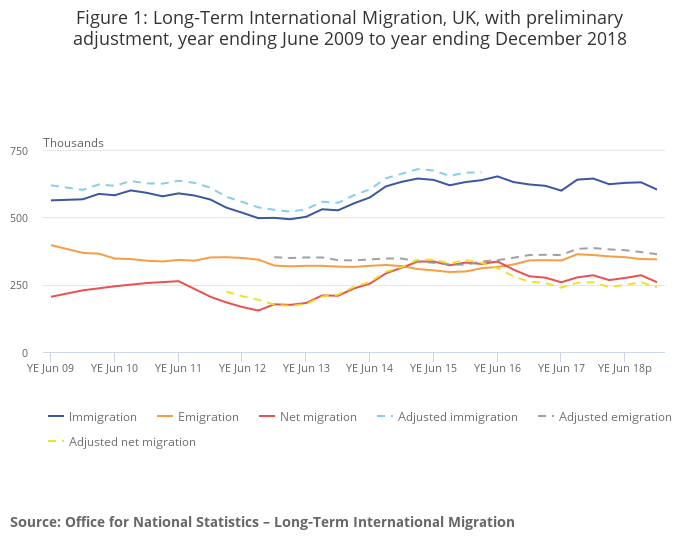
What does this mean for overall net migration? Not that much, actually. The two errors broadly cancel out. Based on what we know from other data sources, the headline net migration figure seems to have been about right.
The adjustments @ONS has made today are important and give us a better picture of what's really going on, but it's not the end of the story. There's still an unexplained gap between IPS and other data sources, and @ONS is planning further work to get to the bottom of this.
In the meantime, they have decided to reclassify the migration stats as "Experimental Statistics" a label designed to communicate that the stats are still being developed, are subject to significant uncertainty and may change over time. So watch this space!

• • •

Missing some Tweet in this thread? You can try to force a refresh
 

Keep Current with Madeleine Sumption

Madeleine Sumption Profile picture

Stay in touch and get notified when new unrolls are available from this author!

Read all threads

This Thread may be Removed Anytime!

PDF

Twitter may remove this content at anytime! Save it as PDF for later use!

Try unrolling a thread yourself!

how to unroll video
  1. Follow @ThreadReaderApp to mention us!

  2. From a Twitter thread mention us with a keyword "unroll"
@threadreaderapp unroll

Practice here first or read more on our help page!

More from @M_Sumption

Oct 5, 2022
Lots of chat in press about possible plans to review/liberalise work visa policy to address labour shortages – and lots of confusion about what the options are and what they’d actually achieve. Here’s a quick thread on the policy options are and their pros and cons. 1/
Background: workers in skilled jobs paying £25,600+ can already get work visas if workers & employers can handle bureaucracy & costs.
Jobs on shortage list are eligible w lower salary (from £20,480 or £10.10/hr).
Seasonal workers in ag & poultry can get 6-month visa (10.10/hr)
3/ Otherwise there are no job-specific work visas, i.e. you can’t qualify for most jobs in hospitality, cleaning, food processing – jobs that previously relied a fair amount on EU free movement.
migrationobservatory.ox.ac.uk/resources/brie…
Read 21 tweets
Apr 16, 2021
NEW: important new report out from @ONS today with first glimpse of the new era of migration stats and it’s pretty interesting.
THREAD
ons.gov.uk/peoplepopulati…
The main report gives revised figures for 9 years to March 2020 using admin data instead of surveys. Total net migration averages 15% higher (43,000/year) in the new data – so not a massive difference given that confidence intervals were around +/- 30-40k anyway
But EU migration makes up larger share of the total in the new figures. With new method, ONS estimates net EU migration averaged 216,000 from during 9-year period ending March 2020. That's 93,000 or 76% higher than previous figures (which had themselves already been revised up.
Read 8 tweets

Did Thread Reader help you today?

Support us! We are indie developers!


This site is made by just two indie developers on a laptop doing marketing, support and development! Read more about the story.

Become a Premium Member ($3/month or $30/year) and get exclusive features!

Become Premium

Don't want to be a Premium member but still want to support us?

Make a small donation by buying us coffee ($5) or help with server cost ($10)

Donate via Paypal

Or Donate anonymously using crypto!

Ethereum

0xfe58350B80634f60Fa6Dc149a72b4DFbc17D341E copy

Bitcoin

3ATGMxNzCUFzxpMCHL5sWSt4DVtS8UqXpi copy

Thank you for your support!

Follow Us!

:(