It is pretty clear that the U.S. tax reform had a large impact on the U.S. BoP data: FDI flows reversed in 2019, as U.S. firms brought back past investments).
But it also may be mucking around with the global data. The fall in inward FDI to the EA correlates with US tax reform
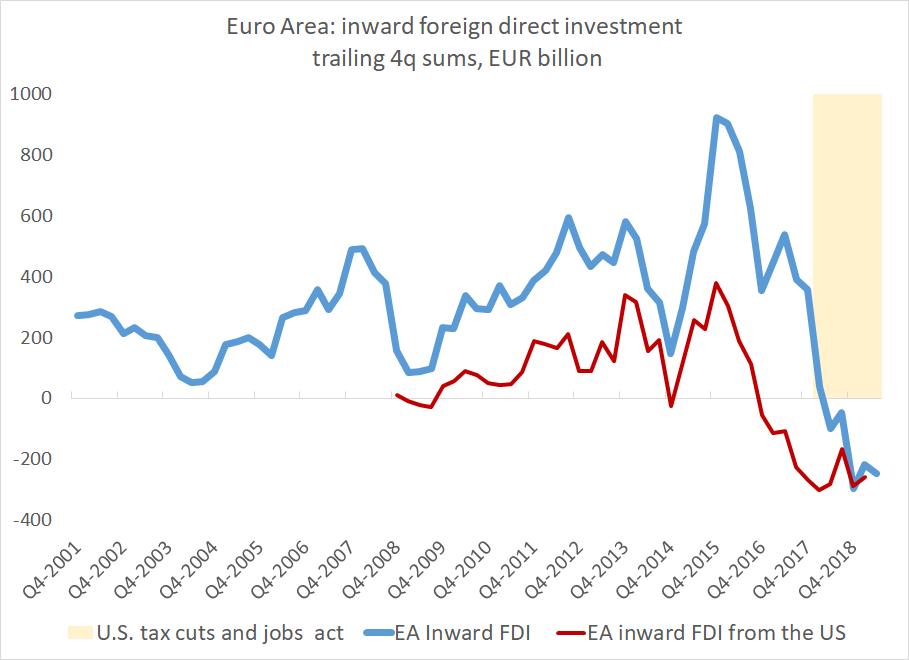
The fit isn't perfect -- the EA data indicates that investment from the US fell off before the tax reform, and I don't understand the mechanism why investment from others into the EA would fall with the US tax reform
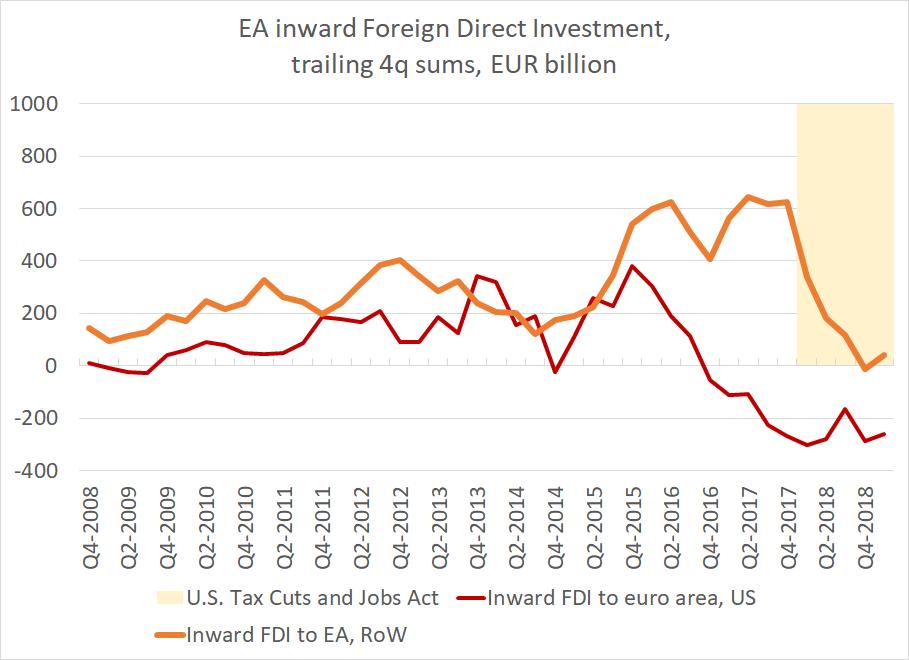
the BoP math is sort of straight-forward:
the "reinvested" (tax deferred) earnings of US firms used to count as an increase in US FDI abroad. So when those funds are returned, US outward FDI falls.
and conversely inward FDI into places like the EA and Bermuda should fall
basically, tax avoidance under the old U.S. law led to a buildup of US FDI abroad (technically), and that is now reversing.
Some will say this is globalization going backwards, but in a real sense it is not ...
in any case, help understanding the EA data would be most appreciated -- outward EA FDI has also gone done it seems, so the net swing is more modest that the change in gross flows over the last 6qs
• • •
Missing some Tweet in this thread? You can try to
force a refresh

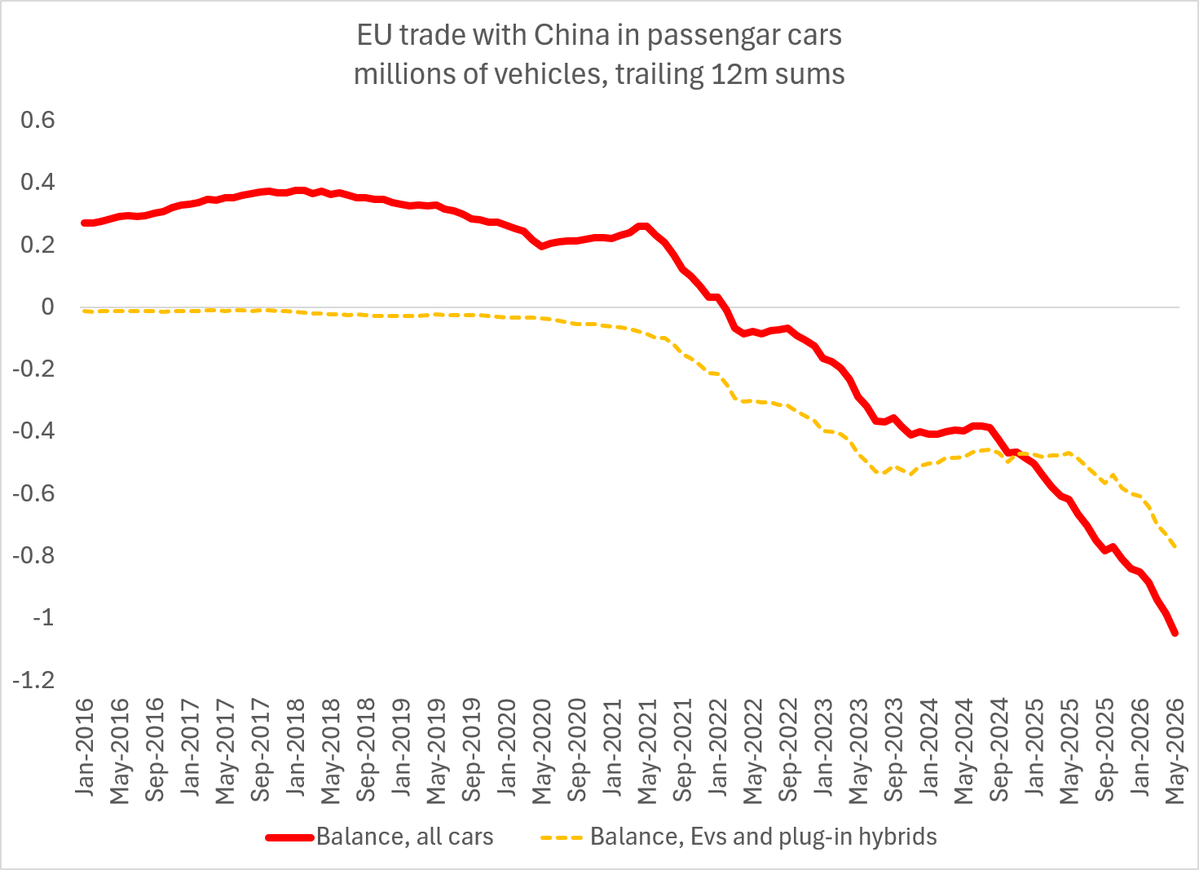
The EU new car market is around 11m cars. Imports from China have now reached just about 1.2m cars, or over 10% of the market. Exports from the EU to China are now under 140,000 cars, or almost 10% of imports
1/many
EU imports of EVs and plug in hybrids from China are over 750,000 (over the last 12ms of data) and heading toward 1m units (EU exports here are now trivial)
2/
The EU's net deficit in auto trade with China (setting value aside, so looking at the number of cars) has now topped 1 million cars
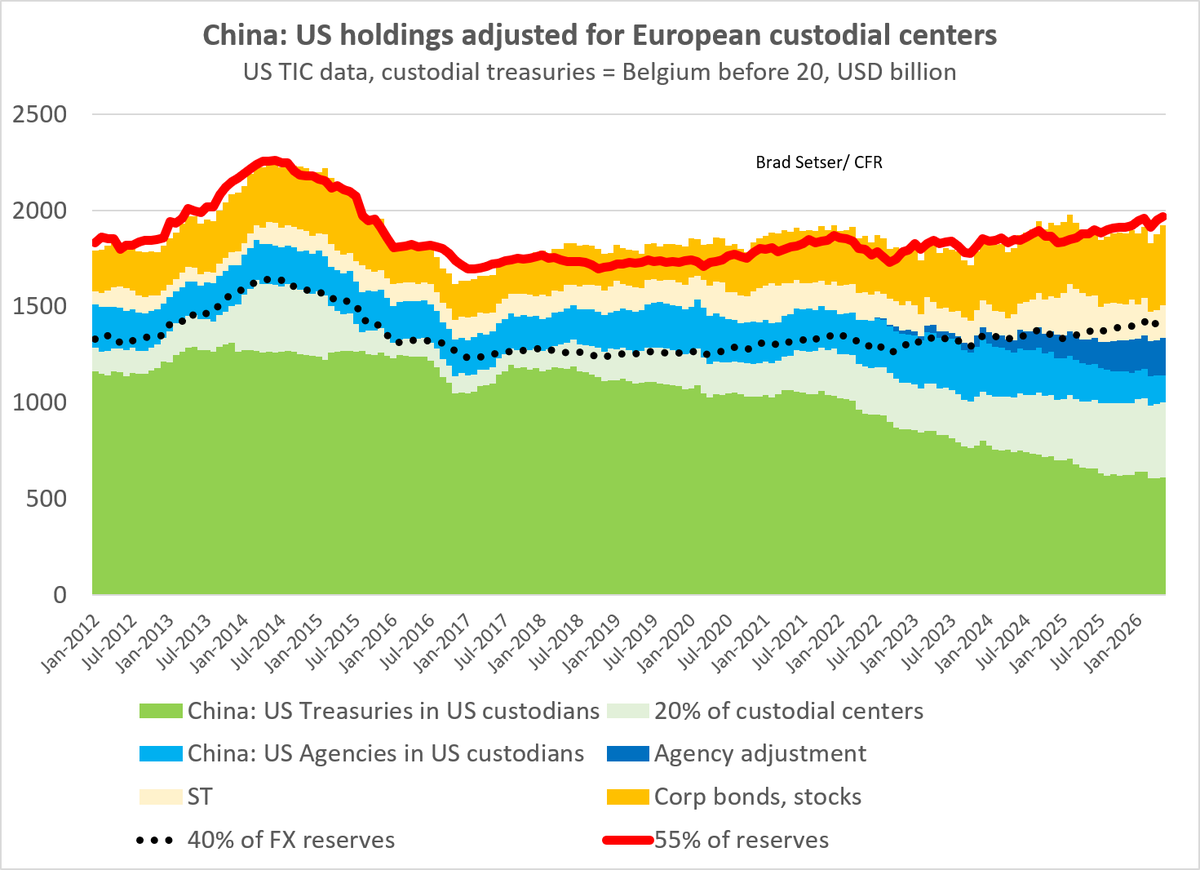
Bottom line upfront: this chart is my best guess as to China's true holdings at SAFE and the CIC (~ $ 2 trillion in US assets). The state commercial banks have additional dollar assets, but they aren't as easy to find in the US data
1/many
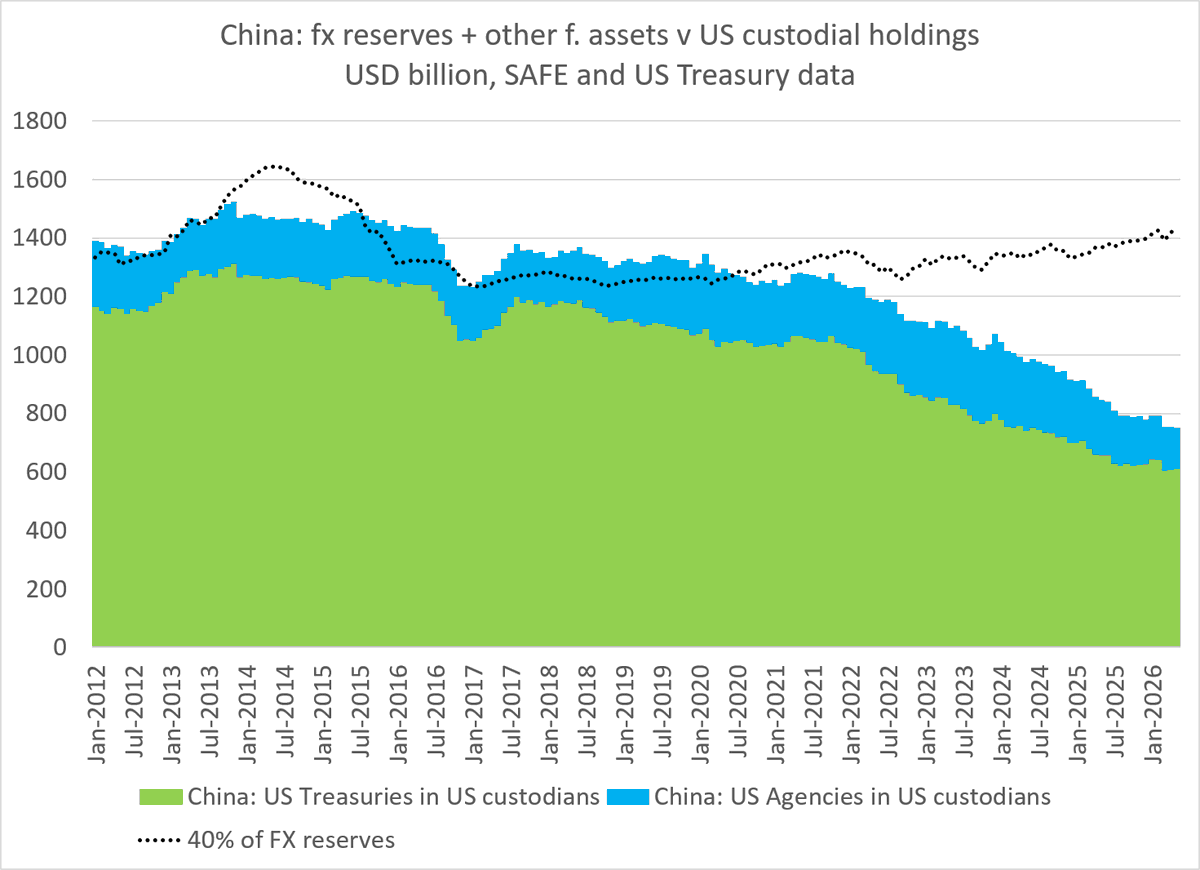
This is of course the set of numbers that many use -- the Treasuries (and Agencies) that are held in US custodians and register as "China" in the monthly TIC data release. Those now well under $1 trillion/ well below China's traditional allocation to safe US assets
2/
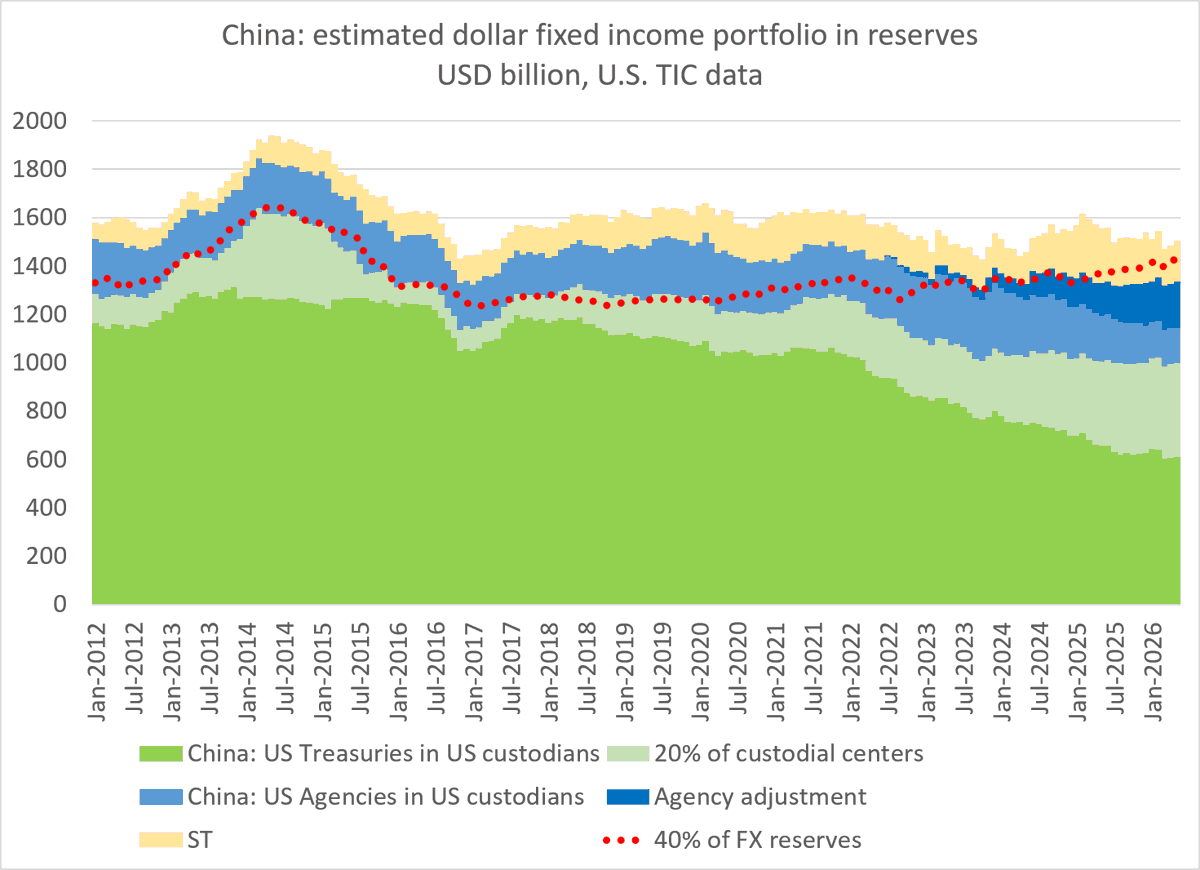
This is closer to what I think China's true allocation to relatively safe US assets is ( a bit over 40% of total reserves). SAFE and the CIC also have a risk tranche that includes US equities (it is known as they say)
You can sort of see why folks talk about a China shock -
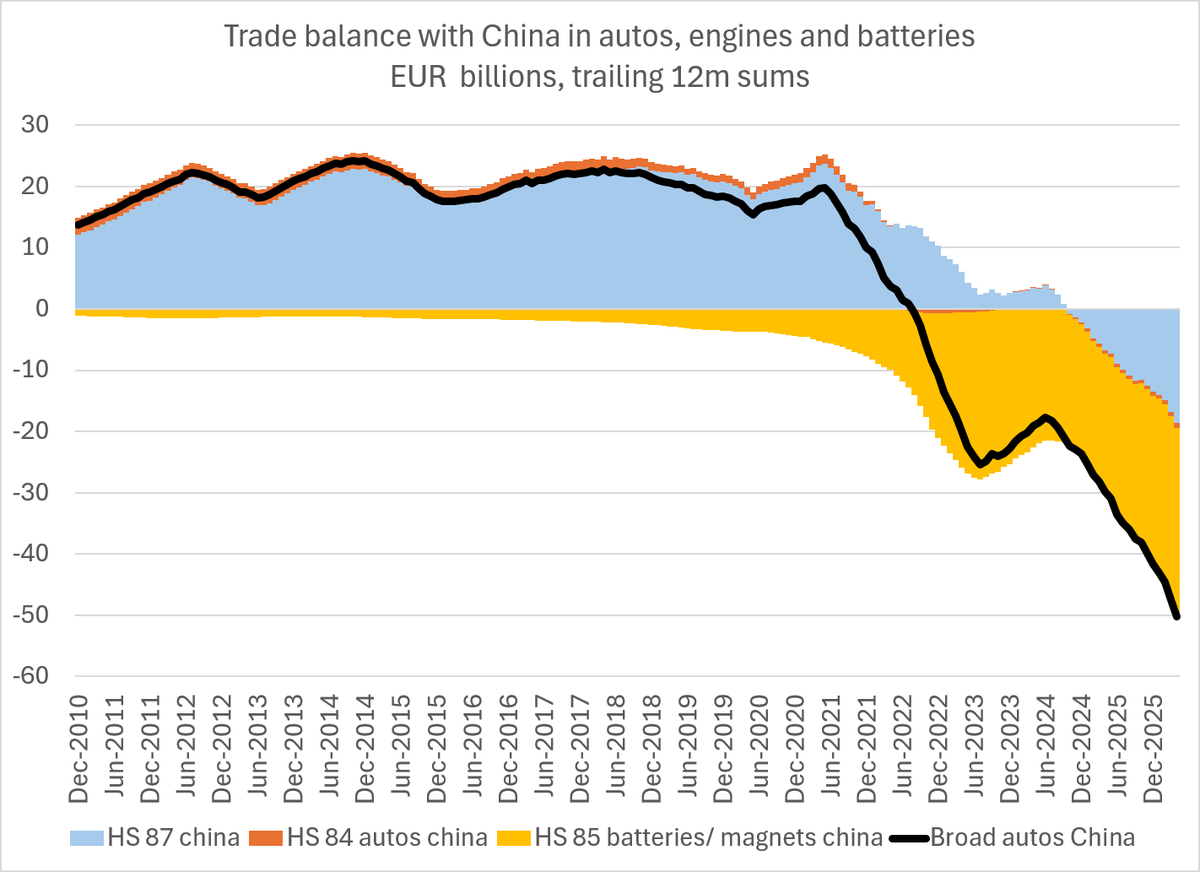
Very clear swing in Europe's trade balance in autos, engines and batteries with China
The first inflection point isn't the pandemic but rather the summer of 21, the second is in 2024 ...
1/
The swing in bilateral trade in autos, engines and batteries is almost 0.4 pp of EU GDP on its own
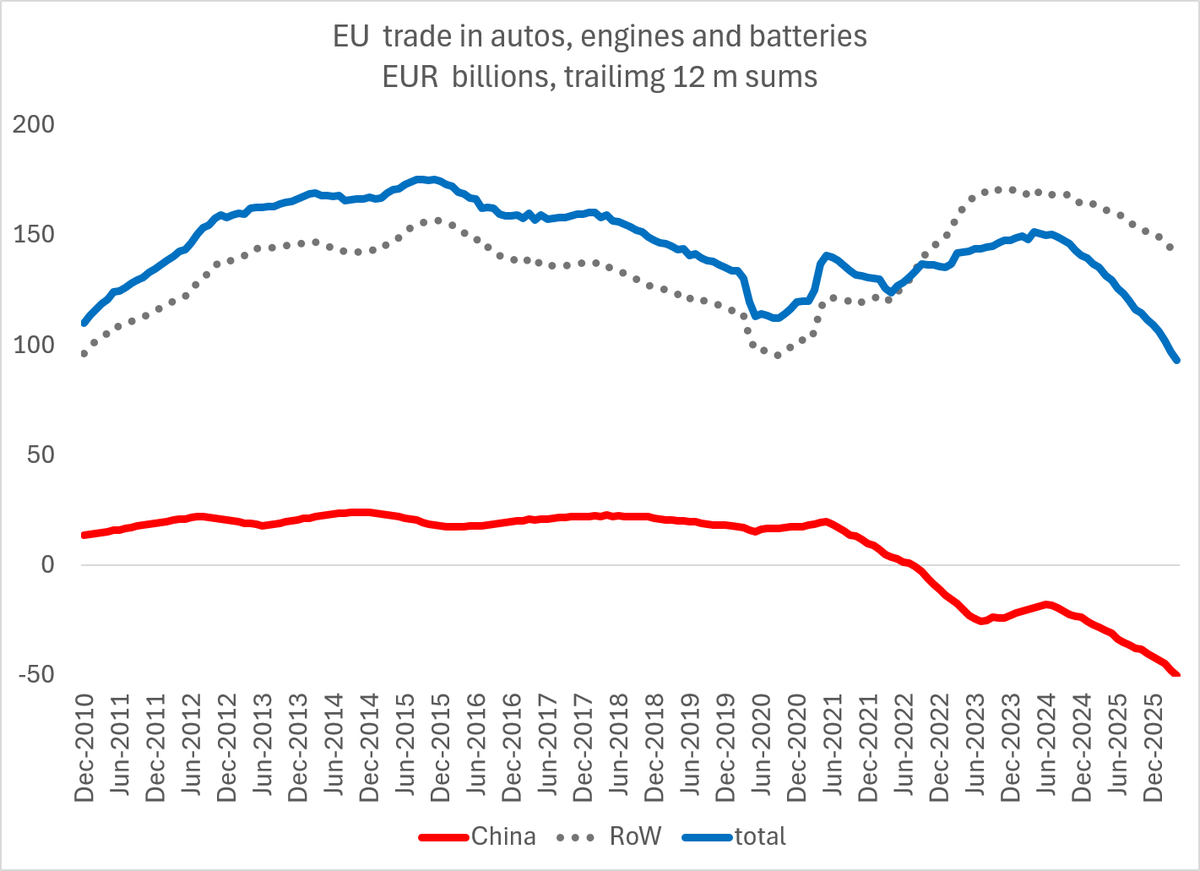
Gavekal argues that Europe's trade has held up well if China is excluded. That's one big exclusion!
The auto, engines and batteries balance ex China has also turned down
2/
The euro value of EU auto exports globally has also been held up by the increase in auto prices (proxied by the rise in export proceeds per kilo of vehicle exports here)
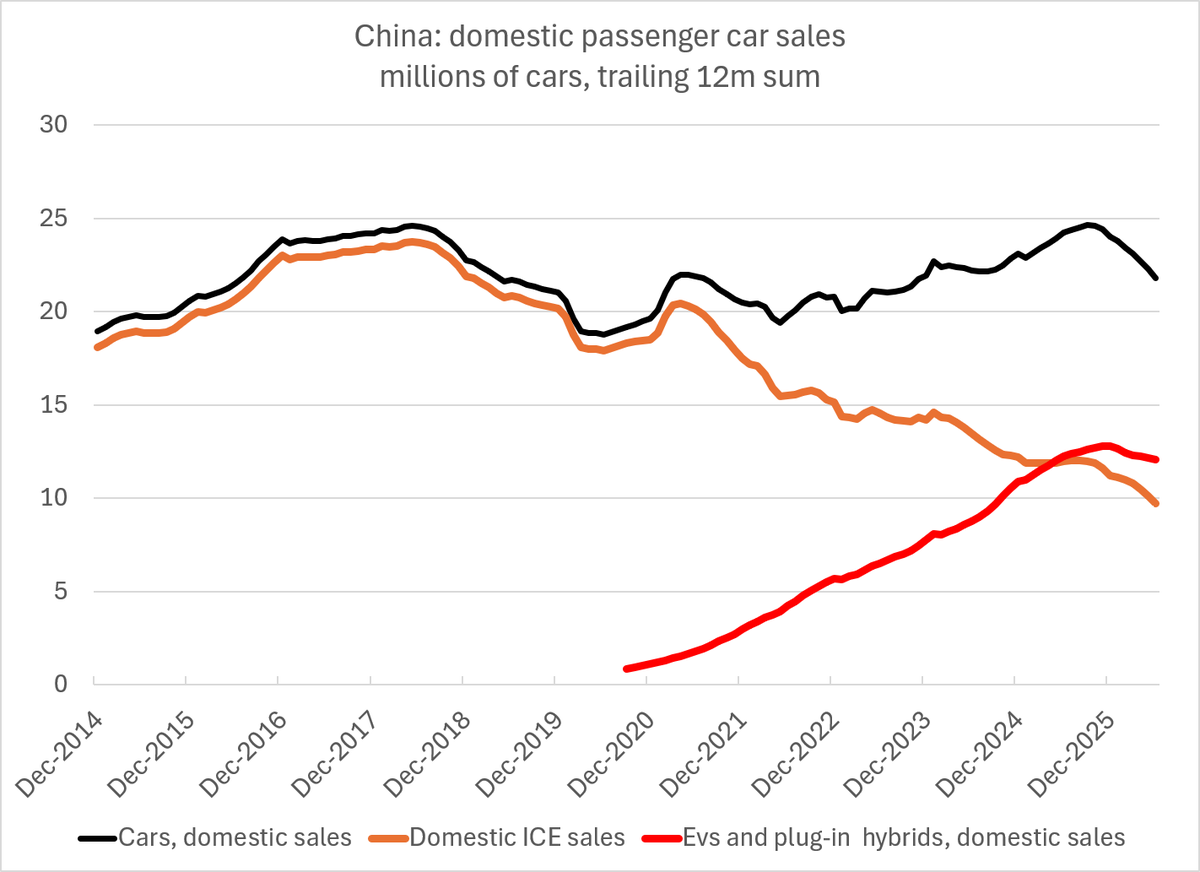
Chinese domestic auto sales remained weak in June. EV sales are now right at 12m cars (over the last 12ms). ICE sales have dipped below 10m
1/
22m in domestic sales and ~ 55m in capacity.
Michael Dunne
"this year China has capacity to build about 55 million cars. Their domestic demand is 25 million. They’ll export another 10 million that leaves 15 to 20 million in excess capacity idle"
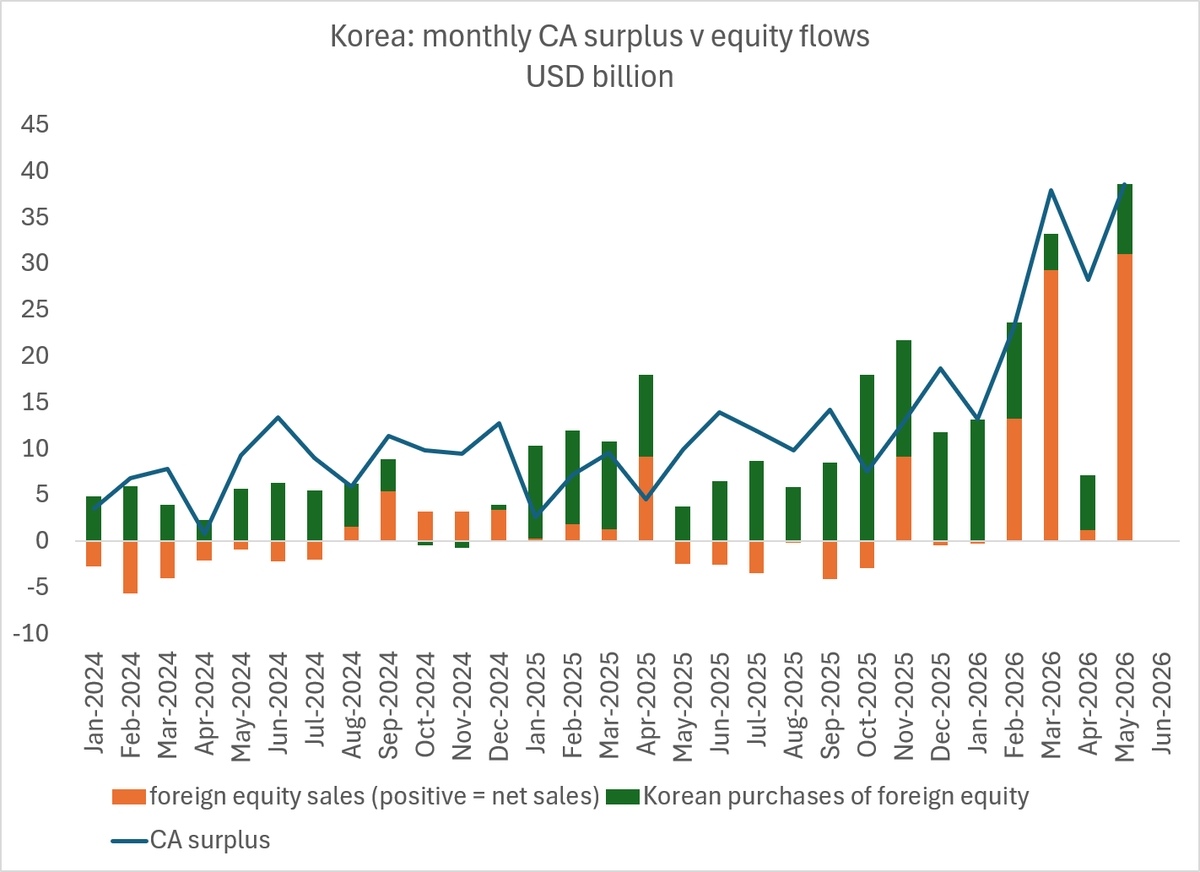
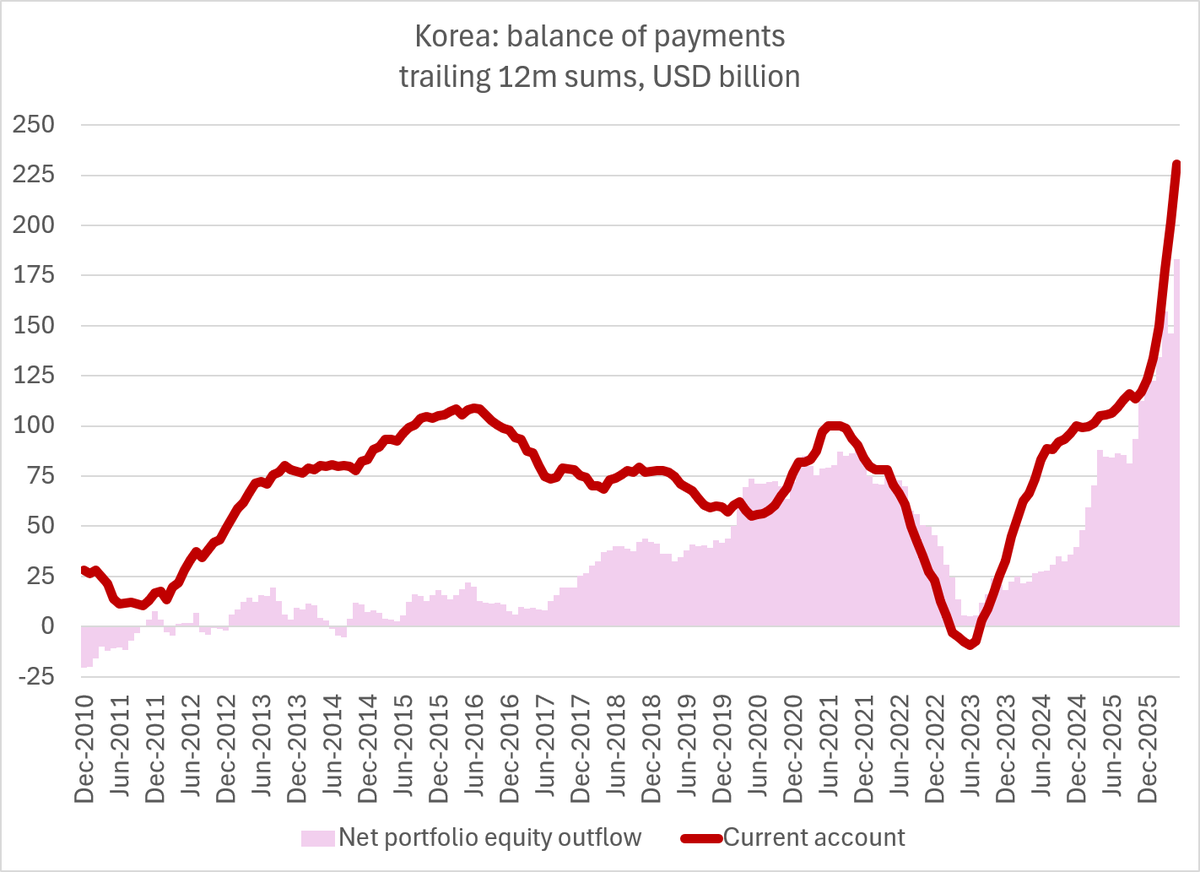
Sometimes you just have to admire how strange the world can be -- Korea's May current account surplus was over $38 billion or $450 billion annualized
Absolutely massive number, the trailing 12m sum hasn't yet caught up
1/
What's more, the massive surplus was offset by massive equity outflows. Primarily foreigners selling Korean equities (presumably to avoid concentration limits ...)
2/
I never expected this kind of surplus (Korea and Taiwan are on a trajectory where they could post a surplus the size of China's reported surplus, i.e ~ $700b, this year) could be balanced by equally large net equity flows --
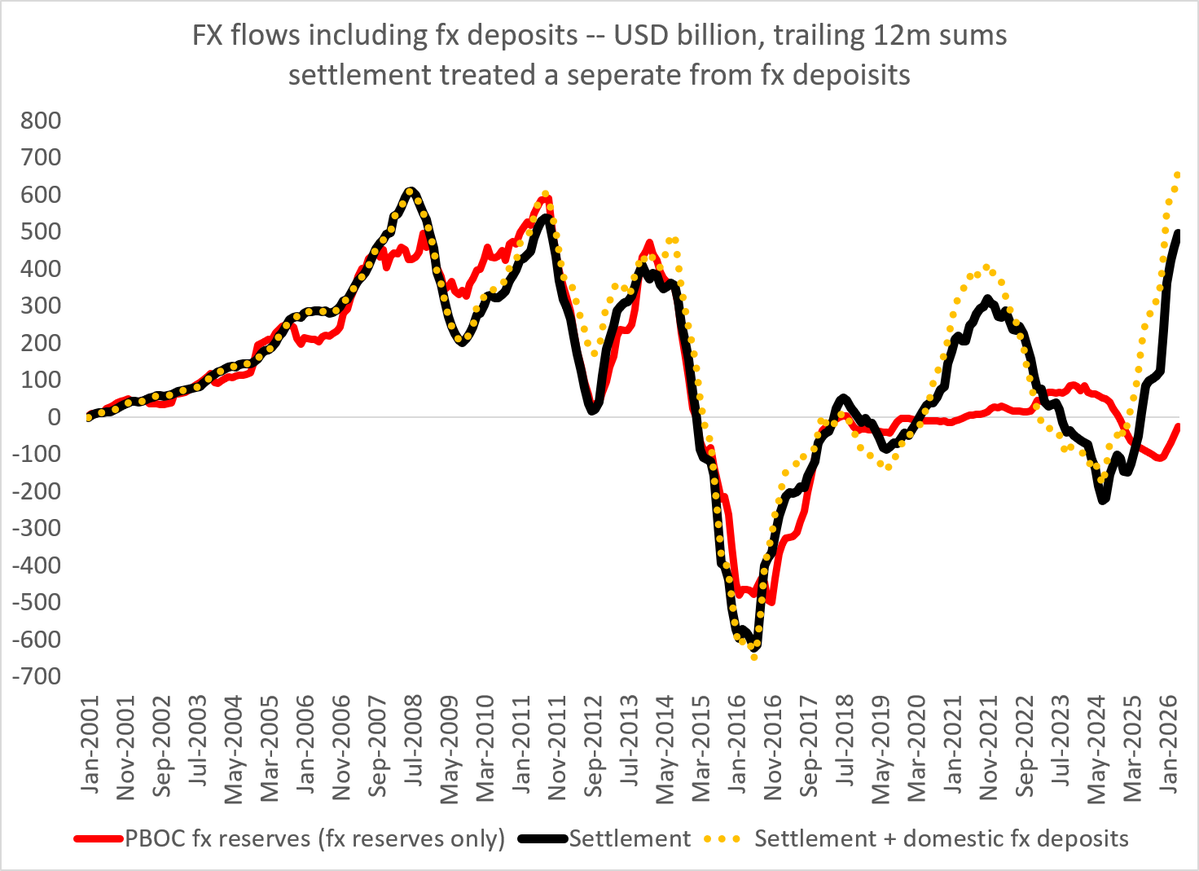
Happy to review the evidence that some of China's exchange rate management results in change to the balance sheet of the state financial sector -- not just changes to the PBOC's formal reserves.
The most important evidence is that fx settlement -- which historically has been an intervention variable (and purchases and sales still correlate with how spot trades inside the band) is no longer showing up on the PBOC's balance sheet (Black and red lines have diverged)
2/
We can debate where that FX is being warehoused - the PBOC doesn't tell us. But in the past it has been moved to both the SCBs and the policy banks. Swaps moved lots of fx over to the state commercial banks before the GFC, and entrusted loans ($95b of which were converted to equity) funded the policy banks
3/