
CFR senior fellow. Views are my own. Writes on sovereign debt, trade, fx reserves and capital flows.
 It disagree that talking about the yuan "gets both the diagnosis and the cure wrong" -- I think the increase in China's surplus cannot be understood absent the RMB's real depreciation, and that an appreciation is a necessary part of any cure
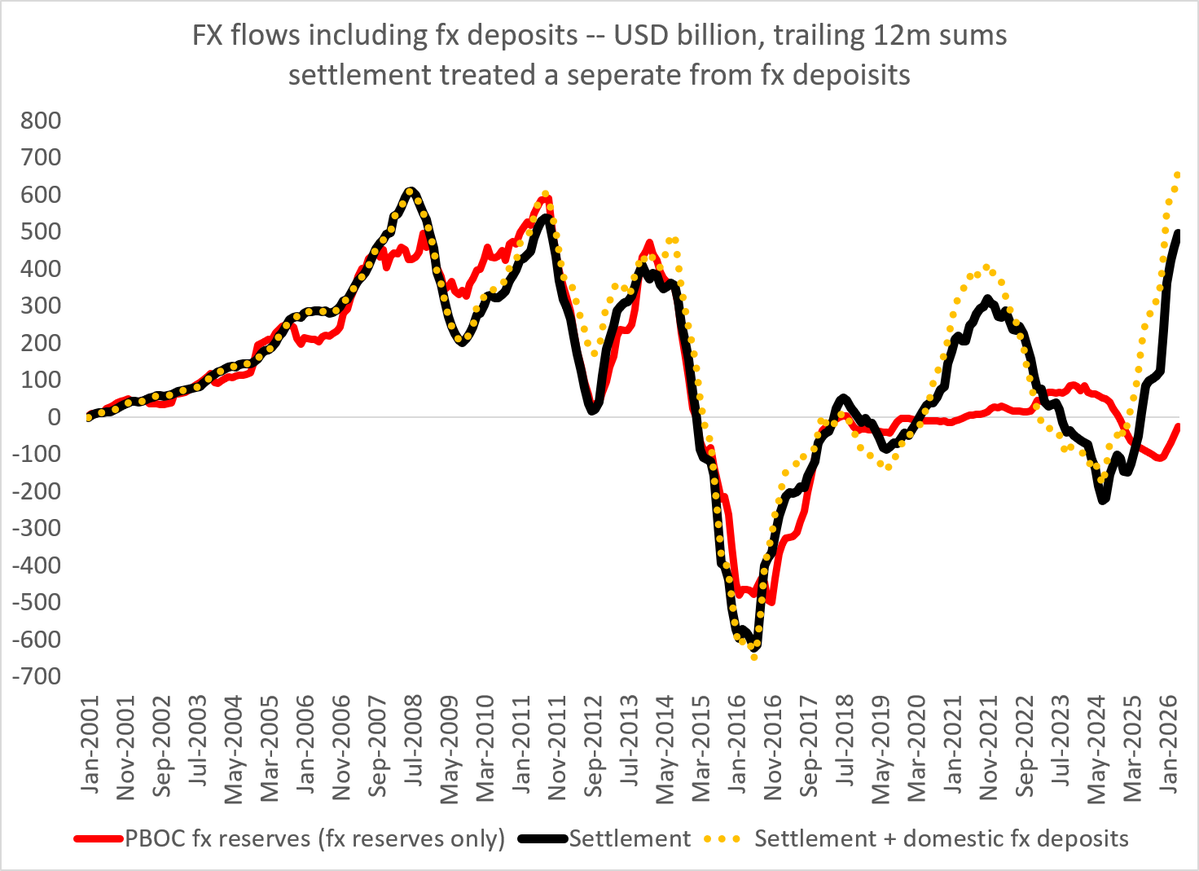
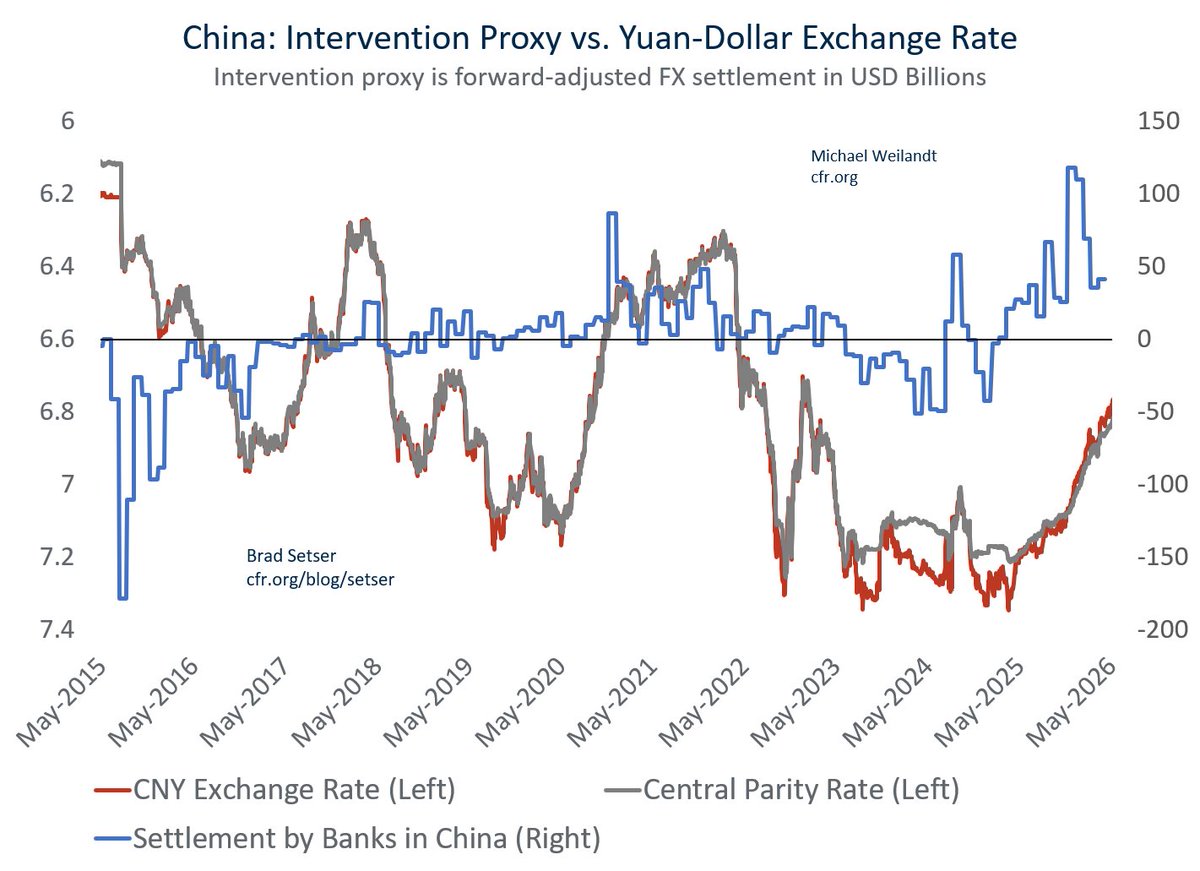
  in dollar terms, ex gold, China's surplus is at record levels (even with the commodity price spike/ chip price spike), with a new leg up this year
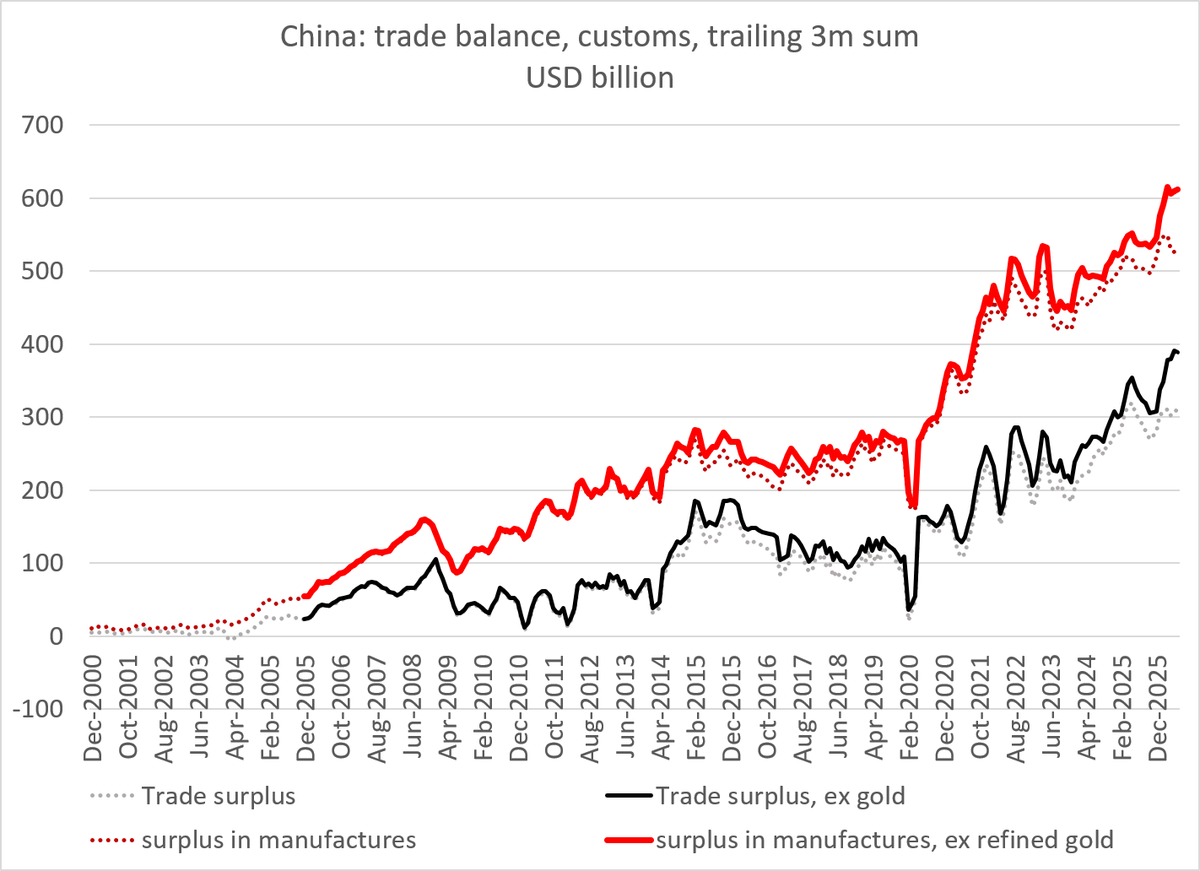
 EU imports of EVs and plug in hybrids from China are over 750,000 (over the last 12ms of data) and heading toward 1m units (EU exports here are now trivial)
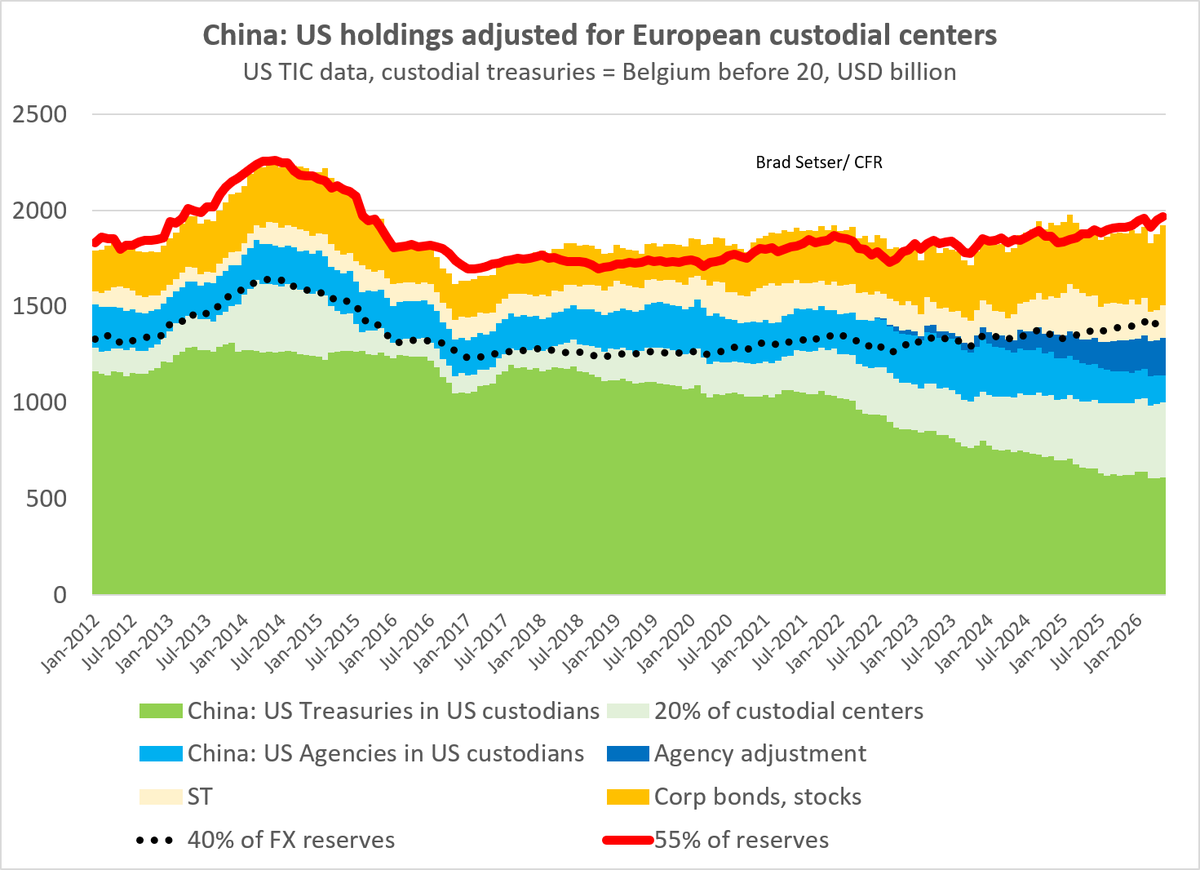 This is of course the set of numbers that many use -- the Treasuries (and Agencies) that are held in US custodians and register as "China" in the monthly TIC data release. Those now well under $1 trillion/ well below China's traditional allocation to safe US assets
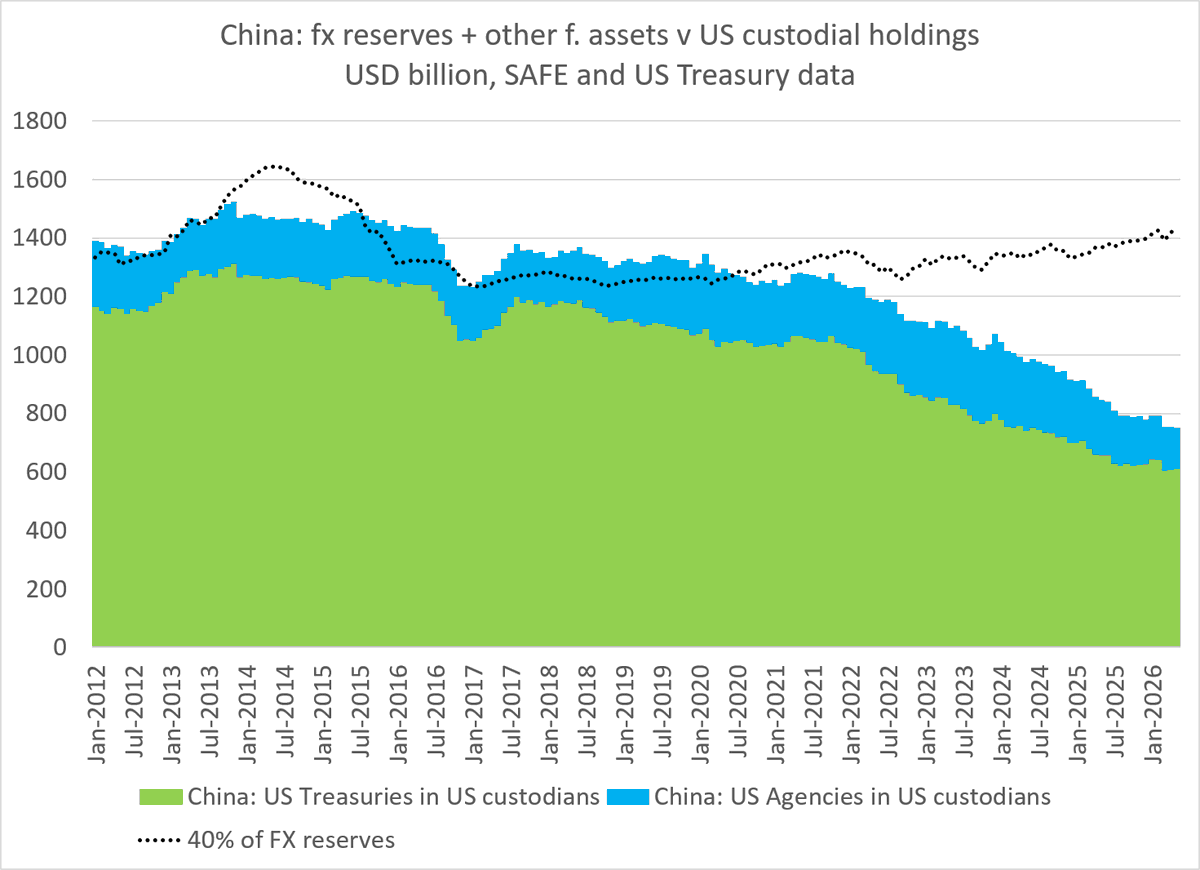
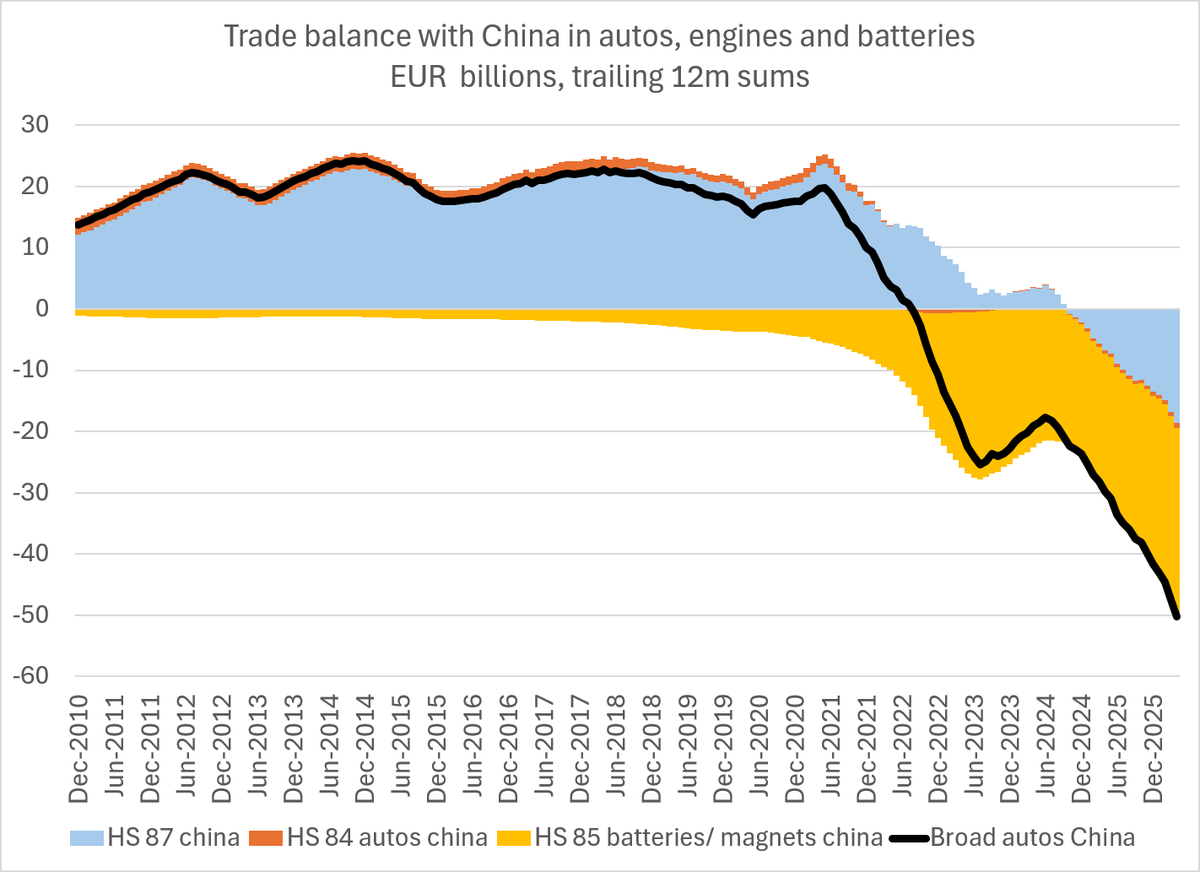 The swing in bilateral trade in autos, engines and batteries is almost 0.4 pp of EU GDP on its own
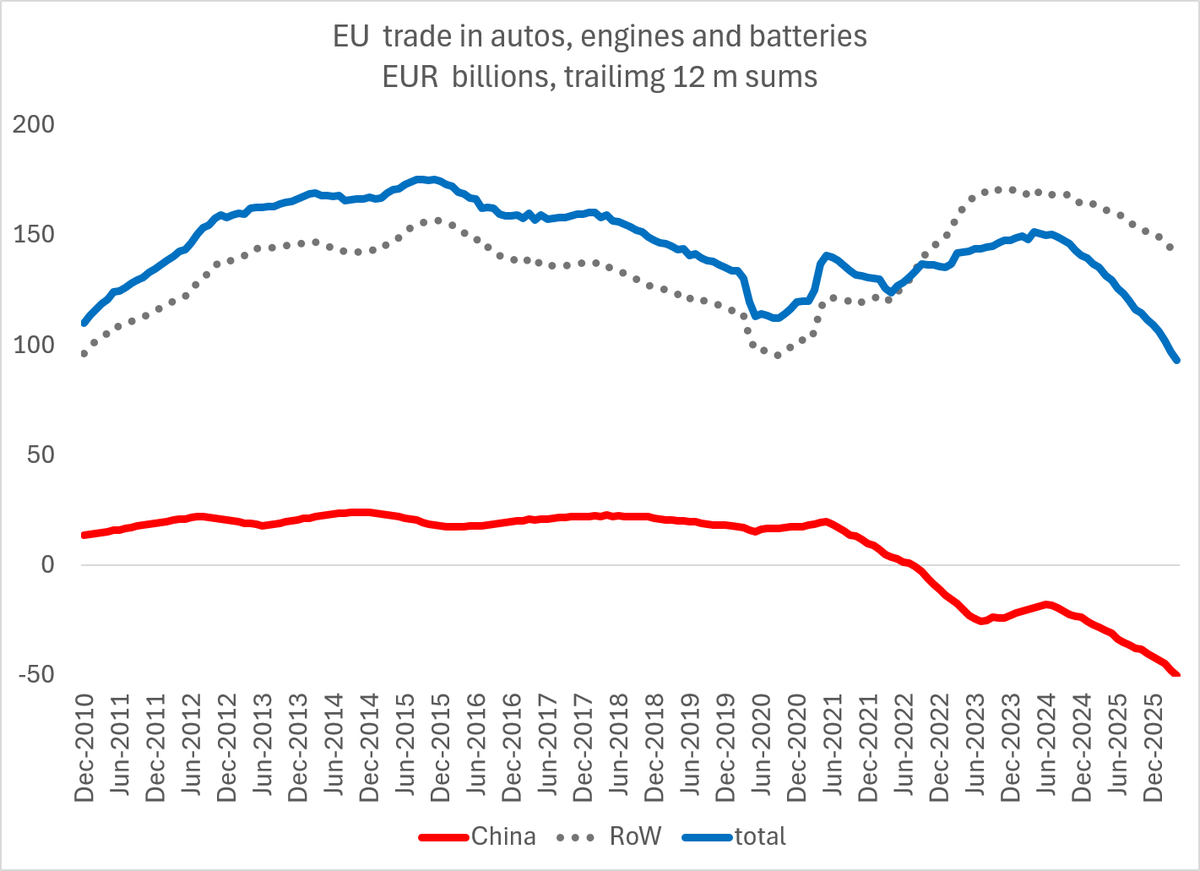
 22m in domestic sales and ~ 55m in capacity.
  What's more, the massive surplus was offset by massive equity outflows. Primarily foreigners selling Korean equities (presumably to avoid concentration limits ...)
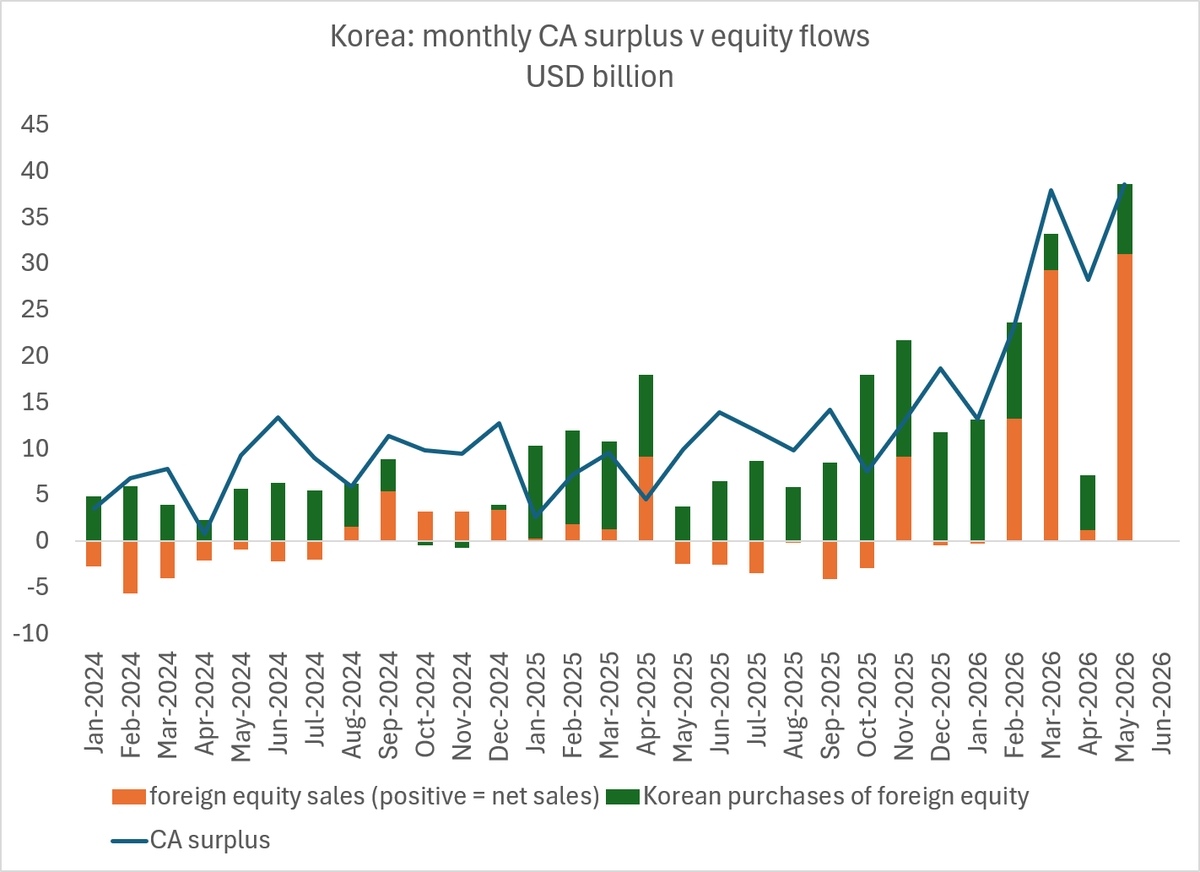

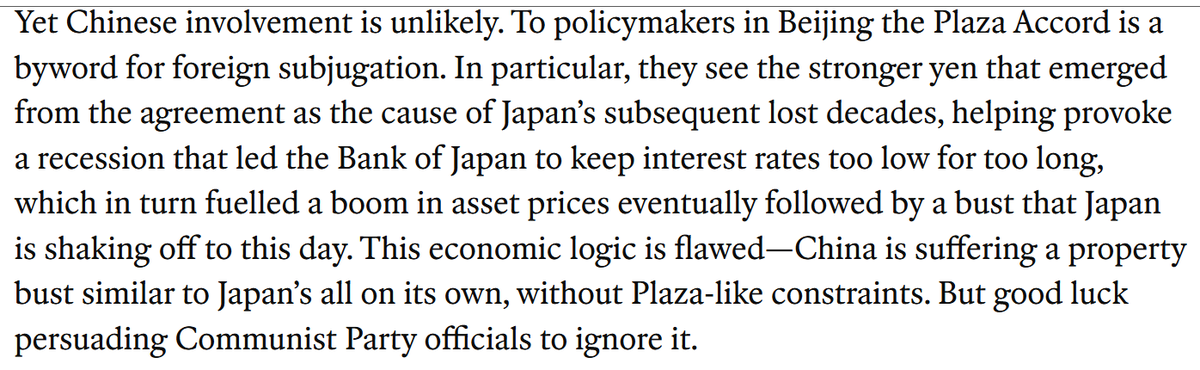 Despite the protests from the Global Times and its echo chamber on this and other sites, I am a bit more optimistic about the possibility that China may agree to allow the CNY to appreciate than the Economist
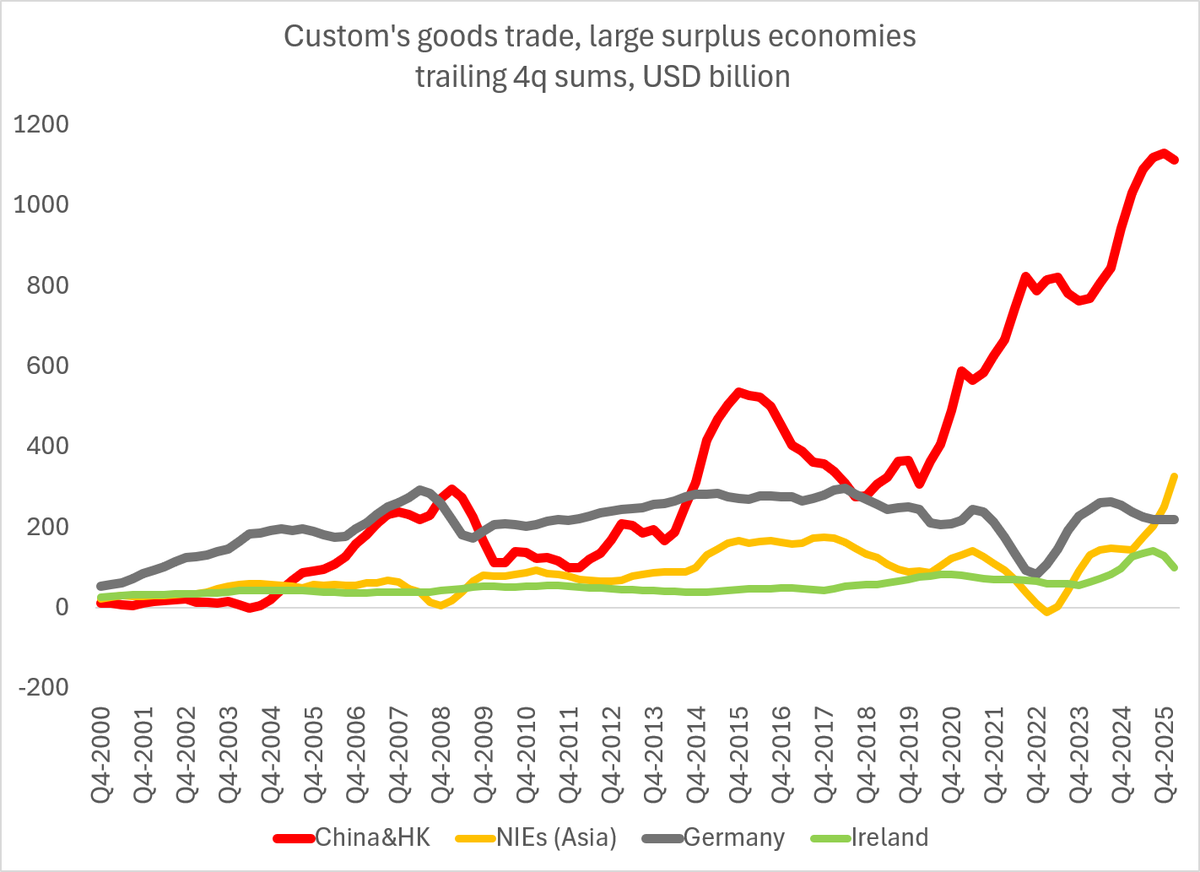
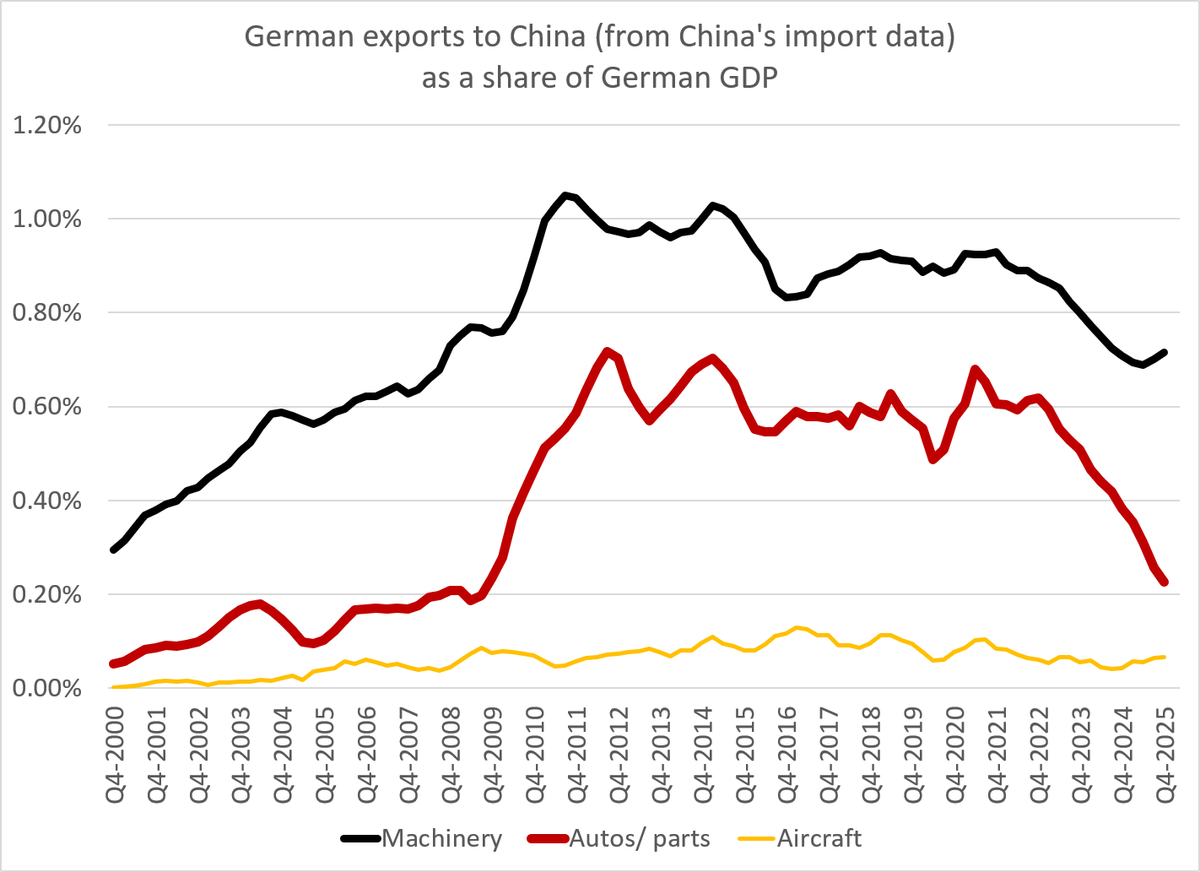
 The detailed data shows that most of China's surplus categories (let by electronics -- a broad category that includes phones and car batteries and chips) are growing, while most of Germany's surplus categories are shrinking. Machinery flipped into a deficit last year
 It is quite clear in the data that Europe's auto exports to China tanked over the course of 2024 and 2025, and imports from China soared in 25 ...
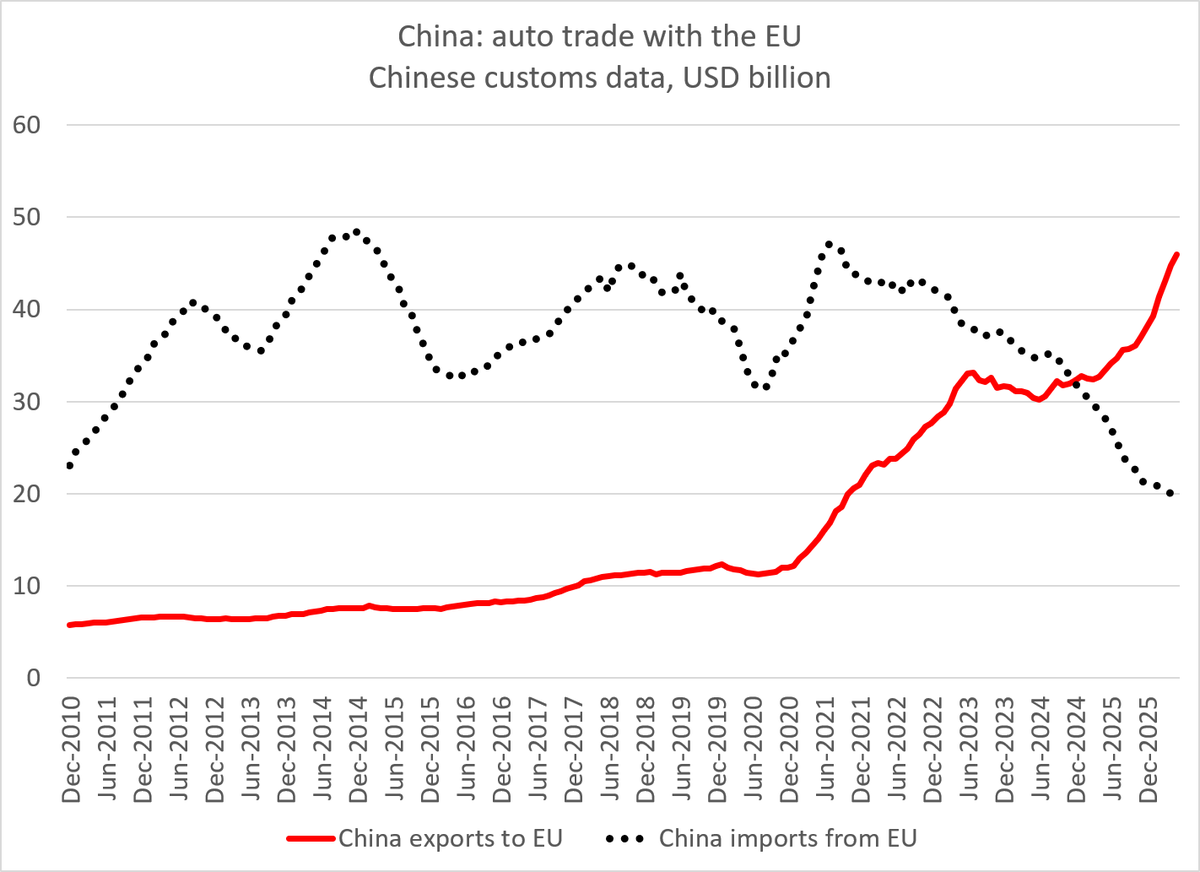

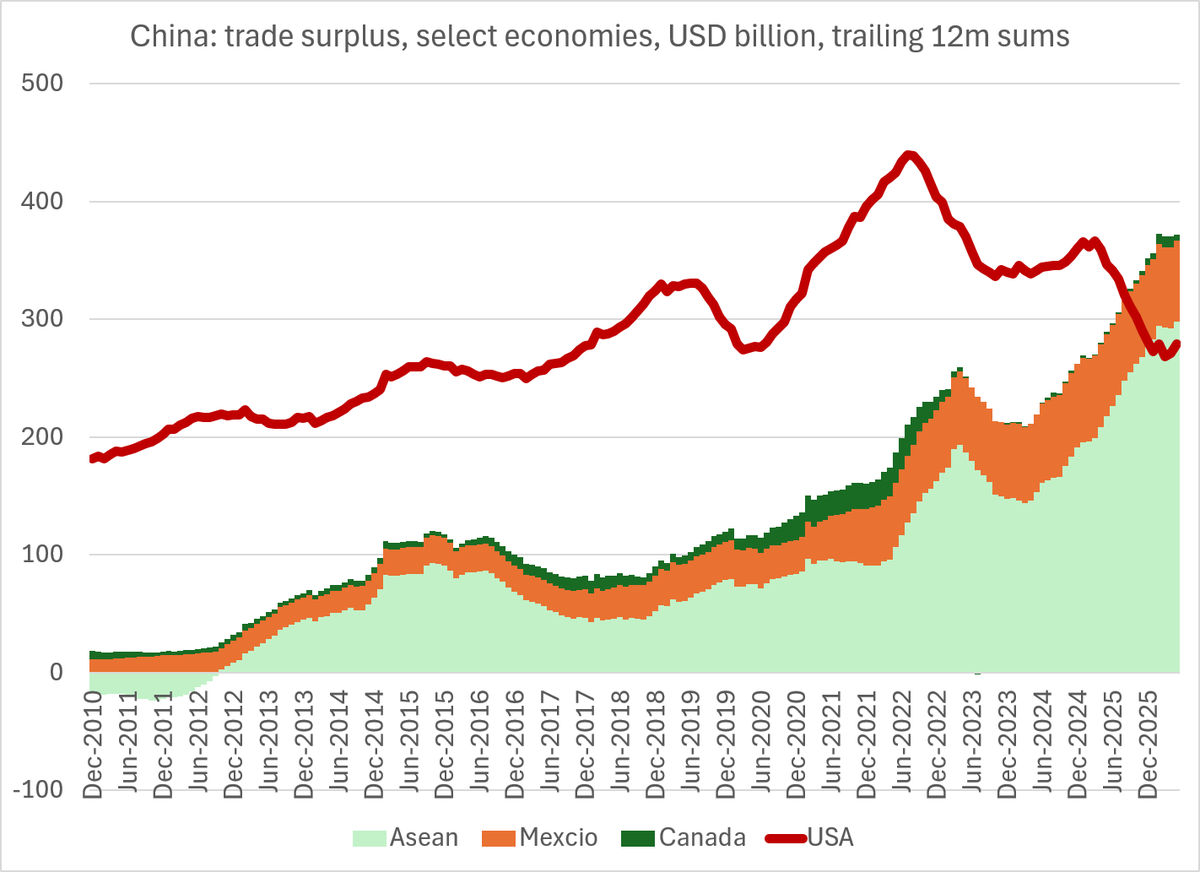
 The Economist leader makes the mistakes I argued that the IMF makes -- thinking that the full current account presents a better picture than customs goods (when in fact the services numbers and income numbers are distorted heavily by Ireland on the European side)

 A bit of background: Korea is experiencing a massive, positive terms of trade shock (chip prices are up so much that it has overwhelmed the rise in price of oil) and Samsung and Hynix are generating massive profits that have pushed the KOPSI way up

 I am not sure this week's Free Lunch column came up with that limiting principle; the notion that "the west might be better off simply leveraging the benefits of Chinese scale" suggests getting out of China's way across the board