Brad Setser Profile picture
Aug 22, 2019 9 tweets 3 min read Read on X
There will be a lot written about financial deglobalization when folks pour over the 2018 data. But it is a mistake to fit last year's financial deglobalization into a Trump trade driven narrative.

It is basically a function of the shift in U.S. tax policy.

(thread)

1/x
The fall in U.S. outward FDI is entirely a function of a fall in U.S. direct investment in the world's tax havens; there was not real change in the pattern of investment in other economies.

(under the old law profits reinvested abroad could defer paying US tax)

2/x
The fall in U.S. FDI "reinvested" abroad in low havens had a host of other effects - firms building up assets in low tax jurisdictions were buying U.S. debt, inflating gross flows in both ways.

(there is actually a good fit in the BoP data here,using flows over last 4qs)

3/x
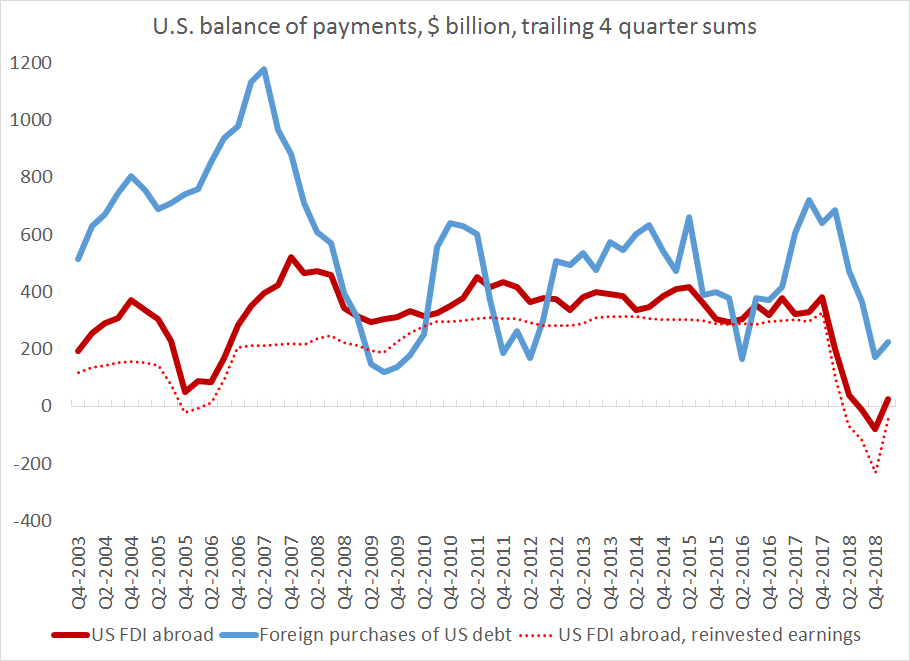
E.g. a lot of US FDI abroad was in practice the rising "cash" of a Techco (Ireland or Bermuda) sub, and a lot of foreign demand for US debt was coming from the same Techcos (or Pharmacos) offshore subs

4/x
I think I have found this in the BoP - the fall in cumulative FDI in a set of tax havens was mirrored by a fall in the cumulative purchases of U.S. debt of a slightly different set of tax havens

(cumulative flows = proxy for the stock" of offshore claims)

5/x
The match here isn't "pure." The debt holdings line for example includes Russia (which moved its reserves out of the US). But other Europe is the breakdown in the US data alas. & I couldn't include the Caribbean's holdings of U.S. debt b/c that was picking up something else ...
but I don't think it is totally spurious. here is the same plot for the set of EA countries that includes Ireland.

Both US FDI in Ireland & Irish holdings of US debt have gone into reverse (the fall in FDI tho is just a fall in the cash held by the Irish subs of US firms)

6/x
and since so much of this involved or touched a euro area country, it has similar implications for the euro area's balance of payments. FDI into the EA fell (US firms were "reinvesting" less in tax havens) and European demand for US debt fell ...

7/7
p.s. will do a blog on this too, but likely not til after labor day ...

• • •

Missing some Tweet in this thread? You can try to force a refresh
 

Keep Current with Brad Setser

Brad Setser Profile picture

Stay in touch and get notified when new unrolls are available from this author!

Read all threads

This Thread may be Removed Anytime!

PDF

Twitter may remove this content at anytime! Save it as PDF for later use!

Try unrolling a thread yourself!

how to unroll video
  1. Follow @ThreadReaderApp to mention us!

  2. From a Twitter thread mention us with a keyword "unroll"
@threadreaderapp unroll

Practice here first or read more on our help page!

More from @Brad_Setser

Oct 18
Year to date (compared to the same period of the previous year) domestic demand has contributed 3.65 pp to China's growth -- so the only reason why China is close to its 5% target is the 1.15 pp contribution from net exports.

1/x
China calculates this number a bit strangely (and it doesn't report the underlying GDP numbers in levels) but my own tracking if anything suggests a bigger net export contribution -- the YTD difference in goods export and import volume growth is over 10 pp

2/ Image
Given that goods exports are just under 20% of China's GDP, that translates into a first order estimate of the contribution of over 1.5% of GDP ...

That's huge for an economy as big as China's economy

3/ Image
Read 6 tweets
Oct 16
Excellent reporting from @Lingling_Wei, highlighting the reasons for Beijing's policy shift, & the limits on that policy shift.

Xi seems to have pivoted in part because he had no real choice; the fiscal troubles of local governments were becoming an independent economic drag

1/ Image
Wei believes Xi supports propping up asset markets (what I have called asset priced based stimulus) and avoiding an immediate crisis in local government finance -- but not a broader shift in economic policy direction

2/ Image
What is still off the table?

"Absent from the measures are any significant moves to boost consumption. People close to the ministry say that such measures are in the works but that nothing substantial is imminent"

3/

wsj.com/world/china/be…
Read 5 tweets
Oct 15
The IMF - at least the fiscal side of the house - likes to lump the US and China together: "global public debt edged up again in 2023 ... with the world’s two largest economies, China and the United States, largely driving the increase"

1/ Image
The IMF wants a rather massive global fiscal consolidation ("fiscal adjustment of 3.0–4.5 percent of GDP, on average") and the IMF's eyes both the US and China (the two bad children, fiscally speaking) need to do more ...

2/

imf.org/en/Publication…
But the differences between the US and China are to me much more significant than the similarities, and by equating the two, the IMF implicitly downplays those differences --

3/
Read 12 tweets
Oct 14
China's vehicle exports, in billions of dollars --

Still a remarkable chart

1/ Image
Germany's exports to China (measured using the Chinese import data) as a share of German GDP --

Rather remarkable fall since the end of 2022 (about half a point of German GDP)

2/ Image
Germany was the one North Atlantic economy that had a real business making goods at home for sale in China, which left it exposed to the second China shock!

3/ Image
Read 5 tweets
Oct 14
One of China's intervention proxies was released today -- the change in the foreign assets held by the PBOC on its balance sheet. They fell, which would be strange given the CNY's appreciation during September.

But the bigger move was over at the state banks

1/ Image
Between the PBOC and the State commercial banks, total foreign asset rose by $20b in September (following a bigger increase in August). And over the last 12ms of data, the combined foreign portfolio of the PBOC and the state banks is up $130b or so ...

2/ Image
Supports the argument that China hasn't faced real balance of payments pressure in either direction this year -- significant at least.

But ...

3/
Read 6 tweets
Oct 9
One chart that shows how little the world has deglobalized (and how little it has fragmented) --

Over time, Asia's good surplus has essentially become a Chinese surplus ... but that surplus equally isn't absorbed in east or southeast Asia

1/ Image
And it just happens to be the case that for the last 4 or 5 years the China-driven rise in Asia's combined surplus perfectly maps to the US deficit --

(the fit is more likely now that the US isn't a net oil importer)

2/ Image
And the most important trend in the full(ish) global data is the Sinicization of the global surplus (China's share of the surplus has gone up, the oil exporters share is now down)

3/ Image
Read 4 tweets

Did Thread Reader help you today?

Support us! We are indie developers!


This site is made by just two indie developers on a laptop doing marketing, support and development! Read more about the story.

Become a Premium Member ($3/month or $30/year) and get exclusive features!

Become Premium

Don't want to be a Premium member but still want to support us?

Make a small donation by buying us coffee ($5) or help with server cost ($10)

Donate via Paypal

Or Donate anonymously using crypto!

Ethereum

0xfe58350B80634f60Fa6Dc149a72b4DFbc17D341E copy

Bitcoin

3ATGMxNzCUFzxpMCHL5sWSt4DVtS8UqXpi copy

Thank you for your support!

Follow Us!

:(