There will be a lot written about financial deglobalization when folks pour over the 2018 data. But it is a mistake to fit last year's financial deglobalization into a Trump trade driven narrative.
It is basically a function of the shift in U.S. tax policy.
(thread)
1/x
The fall in U.S. outward FDI is entirely a function of a fall in U.S. direct investment in the world's tax havens; there was not real change in the pattern of investment in other economies.
(under the old law profits reinvested abroad could defer paying US tax)
2/x
The fall in U.S. FDI "reinvested" abroad in low havens had a host of other effects - firms building up assets in low tax jurisdictions were buying U.S. debt, inflating gross flows in both ways.
(there is actually a good fit in the BoP data here,using flows over last 4qs)
3/x
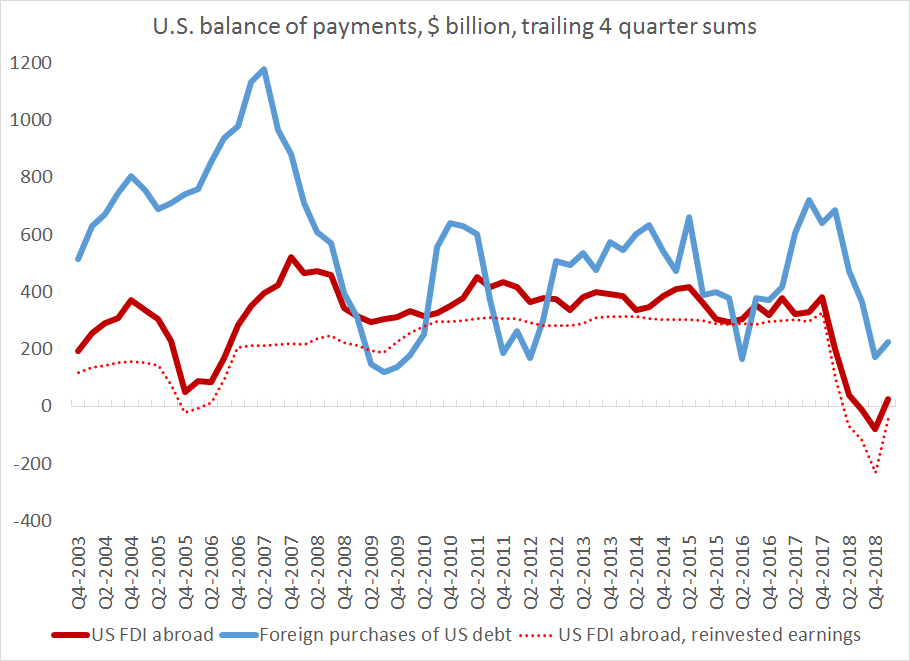
E.g. a lot of US FDI abroad was in practice the rising "cash" of a Techco (Ireland or Bermuda) sub, and a lot of foreign demand for US debt was coming from the same Techcos (or Pharmacos) offshore subs
4/x
I think I have found this in the BoP - the fall in cumulative FDI in a set of tax havens was mirrored by a fall in the cumulative purchases of U.S. debt of a slightly different set of tax havens
(cumulative flows = proxy for the stock" of offshore claims)
5/x
The match here isn't "pure." The debt holdings line for example includes Russia (which moved its reserves out of the US). But other Europe is the breakdown in the US data alas. & I couldn't include the Caribbean's holdings of U.S. debt b/c that was picking up something else ...
but I don't think it is totally spurious. here is the same plot for the set of EA countries that includes Ireland.
Both US FDI in Ireland & Irish holdings of US debt have gone into reverse (the fall in FDI tho is just a fall in the cash held by the Irish subs of US firms)
6/x
and since so much of this involved or touched a euro area country, it has similar implications for the euro area's balance of payments. FDI into the EA fell (US firms were "reinvesting" less in tax havens) and European demand for US debt fell ...
7/7
p.s. will do a blog on this too, but likely not til after labor day ...
• • •
Missing some Tweet in this thread? You can try to
force a refresh
China, via its state banks, bought a record $118 billion of fx in the market (counting forward purchases) in December.
A new record. Game on
1/
Some obvious reasons for the spike, which maps to ongoing reports of SCB purchases in November:
A massive trade surplus creates underlying potential for big inflows;
and exporters tend to convert FX into CNY (forcing the banks or the PBOC to buy fx) when the CNY is rising
2/
The PBOC's strange sale of its formal reserves stopped in December (was this diversification into gold/ commodities) but the PBOC didn't add to its formal reserves either
A few words on China's demand for US assets (or the last of visible demand for US assets) based on the q3 BoP data. The old rule of thumb was bond inflows equal to China's surplus. The new rule of thumb is no flows and no correlation ...
1/
Even adjusting for Euroclear (part owned by the PBOC incidentally) and short-term holdings, there is no visible net flow from China into the US bond market over the last 8 years ...
2/
And with China's reserves falling in China's BoP data (flow based) and the state banks not registering in the US data, there is no reason to think China's visible US portfolio should be increasing
The April ("liberation day") tariffs prompted a brief wobble in the financial markets. The August tariffs didn't -- and that is reflected in the capital flow data in the BoP, which shows solid bond inflows into the US in q3
1/
The balance of payments data doesn't provide any detail on hedging -- but the total flow into US bonds has been pretty stable at a $600-700b annual pace. And (net) inflows into US equities have been unusually strong (and equity flows typically are not hedged)
2/
There was a bit of a shift from Treasuries to corporate bonds in the US data in recent quarters.
And in q3 the inflow into bonds of all kinds topped the current account (the big quarterly swings are from pharma and gold)
Very strong December for China's auto exports. Vehicle exports for the month were close to 1 million -- and I estimate passenger car exports will come in at 850K for the month, or a 10m annualized pace
1/
The export numbers are so big that they obscure the fall in imports -- but that has also been impressive.
2/
And as this chart shows, the rapid development of the export sector (net exports of passenger cars were zero in 2020, and will be ~ 6.5m in 2025 with a much higher number for q4) has driven the overall increase in China's auto production, not d demand
How did China manage to raise its (customs) trade surplus by $200b to close to $1.2 trillion (and by more in volume terms) even amid the US trade war?
Well, part of the answer is a big rise in its surplus with Europe
1/
China's total surplus with Europe, in dollar terms, topped the pandemic surplus ... as Europe's exports to China have stalled and China's export to Europe keep on rising ...
2/
China's surplus with the US is way down (+30% on tariffs til November did have an impact) as China's exporters knew what to expect and were ready it seems ...
I of course think that China should allow its currency to appreciate -- the yuan is absolutely very weak (see the PPP comparisons) and, in real terms, it is about as it weak as it has been in the last 15 years while China's trade surplus is at an all time high
2/
And I don't think the magnitude (and breadth) of China's sustained export outperformance (in volume terms) over the last two plus years can be explained w/o reference to the yuan's real depreciation in 22/23