Jason Furman Profile picture
Sep 18, 2019 8 tweets 4 min read Read on X
I assessed what the macro data tells us about the Tax Cut & Jobs Act for @AEIdeas. My bottom line: "not much". Since passage GDP growth has slowed slightly as slowing consumption & investment growth only partly offset by faster govt spending. #TCJANowWhat aei.org/publication/no… Image
The second sense in which the data tell us "not much" is that is the difficulty of extracting the signal (the effect of the tax cut) from the noise (the effect of the Fed, global economy, trade war, oil prices, fiscal stimulus, etc. etc. etc.)
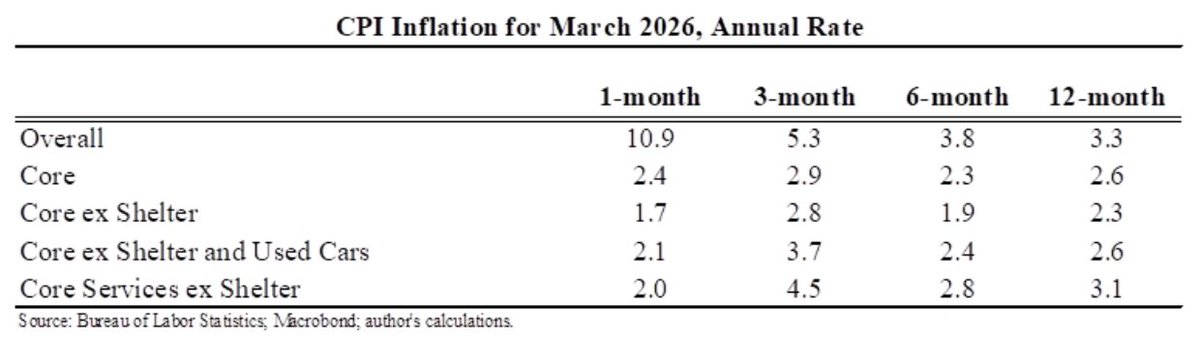
A lot of sector-specific stories are important. This table tells some of them: (i) oil-related investment growth slowed dramatically as oil prices stopped their rapid rise; (2) software and R&D growth increased for reasons unrelated to the TCJA; and (3) everything else slowed. Image
At least three macro stories are also important but go in different directions: fiscal stimulus boosted the economy while the trade wars and interest rate increases went in the opposite direction.
Sorting all of this out the main conclusion is that the second sense of "not much" (hard to extract the signal from the noise) reinforces the first sense of "not much" (if the tax cut was so important relative to everything else we would see the signal much more clearly).
The best hope for a better understanding of the causal impact of the TCJA will be microeconomic research that looks at how similar firms are affected differently by the law and tracking their differential responses.
Ultimately, however, the most important issue is what to do going forward. I believe we can have a more efficient business tax system while raising more revenue than the current system. I couldn't explain it in 280 characters so you'll have to read the image. Image
I really appreciate @aparnamath and @erinmelly2 inviting me to write this--and recommend you stay tuned for the all star cast they have doing upcoming blogs on the TCJA drawing on a diverse set of expertise and perspectives. aei.org/tag/trumps-tax…

• • •

Missing some Tweet in this thread? You can try to force a refresh
 

Keep Current with Jason Furman

Jason Furman Profile picture

Stay in touch and get notified when new unrolls are available from this author!

Read all threads

This Thread may be Removed Anytime!

PDF

Twitter may remove this content at anytime! Save it as PDF for later use!

Try unrolling a thread yourself!

how to unroll video
  1. Follow @ThreadReaderApp to mention us!

  2. From a Twitter thread mention us with a keyword "unroll"
@threadreaderapp unroll

Practice here first or read more on our help page!

More from @jasonfurman

Jul 25
Surprisingly strong GDP growth in Q2: 2.8% annual rate. Volatile/transitory factors pushing in opposite directions so my preferred signal of Final sales to private domestic purchasers was an also strong 2.6% annual rate.

Overall GDP 1% above CBO's pre-pandemic forecast. Image
Note the overperformance relative to CBO's pre-pandemic forecast is due to a combination of employment being well above expected while productivity has been a bit below expected.
Here is the quarterly pattern for GDP. For the first half of the year GDP is up at a 2.1% annual rate. That is exactly the median expectation for the year in the FOMC's Summary of Economic Projections (both the March and June ones). Image
Read 7 tweets
Jul 11
The CPI-based Ecumenical Underlying Inflation measure came in at 2.5% in June.

This is the median of 21 different measures (7 concepts over 3, 6 and 12 months)--all remeaned to match the PCE targeted by the Fed. Image
Note that core ex shelter is also below the Fed's 2% target on a 3, 6 and 12 month basis (a few other measures also below on the more volatile 3 month basis).

If you look at core PCE ex housing will still likely be above the 2% target. Plus the Fed includes housing.
The trimmed mean and median measures were considerably higher in June than the other measures. Suggests some of the good number was volatile components--and the signal a little less stark.

I'm mostly seeing forecasts for 0.20% core PCE in June.
Image
Image
Read 5 tweets
Jul 11
Amazing inflation data for June!!!

A big slowdown in shelter growth meant that core was up only 0.1% (0.8% annual rate). That + transitory gasoline decline drove headline down 0.1% (0.7% annual rate).

Over the last 3 / 6 /12 months core has been:

1.1% / 3.3% / 3.3% Image
No matter how you look at it inflation was basically non-existent during the month of June. Here are the full set of numbers. Image
A big part of the story is the shelter growth was the slowest it has been the entire inflationary period. Image
Read 7 tweets
Jul 5
The economy added 206K jobs in June, continuing at about the same pace it has all year.

The unemployment rate rose by 0.1pp but at the same time participation rose 0.1pp so the employment rate was unchanged.

Hourly earnings up 0.3%. Image
The nerve wracking part of recent data is that the unemployment rate has been very slowly rising for a year now. The 4.1% by itself is perfectly fine, in fact low by historical standards. But whenever urate has risen a little it has risen a lot and tipping us into recession. Image
The Sahm Rule is a perfect predictor of past recessions: 3-month moving average compared to the low of the last 12 months with a threshold of 0.5. Currently is 0.4, so not triggered.

But if you do min for last 18 months we're at 0.5.

And of course, macro laws not physics.
Read 9 tweets
Jul 2
Job openings per unemployed worker remained at 1.2 for the second month in a row in May. That is what they were just prior to COVID. Image
All five of the measures of labor market tightness I pay the most attention to are very close to their pre-COVID values (at most 0.7 standard deviations away). Image
In particular, I would highlight the quits rate which has been 2.2% for seven months in a row. People are quitting slightly less than prior to COVID, an indicator of what they think about job opportunities elsewhere.

Note job growth for wage switchers way down.
Image
Image
Read 5 tweets
Jun 28
PCE inflation came in even lower than you would have expected from the CPI/PPI earlier this month. Core PCE was up 0.08% and overall PCE actually fell 0.01%.

Core at an annual rate:

1 month: 1.0%
3 months: 2.7%
6 months: 3.2%
12 months: 2.6% Image
Here are all the numbers I'll be discussing in this thread. Image
One thing to note is that market core, which excludes imputed items like portfolio management fees, was up at a 1.9% annual rate in May. It behaves similarly over longer periods but has less month-to-month volatility than headline core inflation. Image
Read 7 tweets

Did Thread Reader help you today?

Support us! We are indie developers!


This site is made by just two indie developers on a laptop doing marketing, support and development! Read more about the story.

Become a Premium Member ($3/month or $30/year) and get exclusive features!

Become Premium

Don't want to be a Premium member but still want to support us?

Make a small donation by buying us coffee ($5) or help with server cost ($10)

Donate via Paypal

Or Donate anonymously using crypto!

Ethereum

0xfe58350B80634f60Fa6Dc149a72b4DFbc17D341E copy

Bitcoin

3ATGMxNzCUFzxpMCHL5sWSt4DVtS8UqXpi copy

Thank you for your support!

Follow Us!

:(