
Professor at Harvard. Teaches Ec 10, some posts might be educational. Also Senior Fellow @PIIE & contributor @nytopinion. Was Chair of President Obama's CEA.
 Two years ago the unemployment rate was 4.1%, now its 4.2%. That is almost unheard of to plateau at a low level like that--and even more so to have adjusted up from about 3.5% without continuing up.
 Full set of numbers.
 And the full set of numbers.
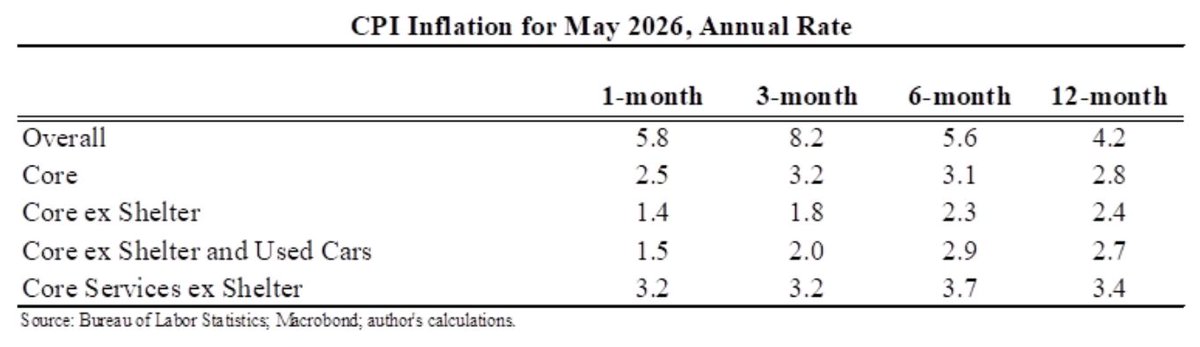
 The unemployment rate stayed at 4.3%. It has now been at or below 4.5% for 56 straight months. The last time this happened was in the last 1960s.
 Before I go on with the numbers, here's a link to the new piece. nytimes.com/2026/04/10/opi…
 We're past the large shifts in government jobs that were confusing the interpretation of overall jobs numbers last year. But still, I'll show you the private numbers (possibly the last time until needed again)--you can see the difference between this and total from last year.
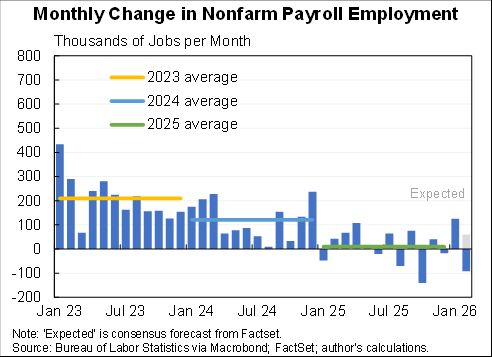 The dynamics for private employment look just like overall (86K lost in private with govt basically flat.
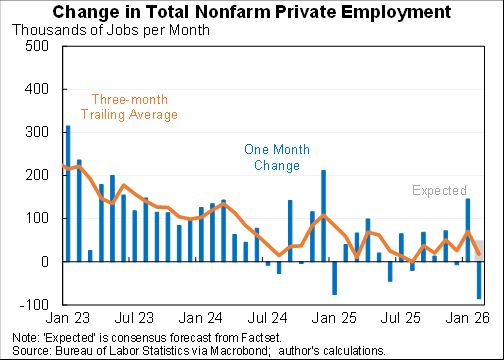
 Full numbers.
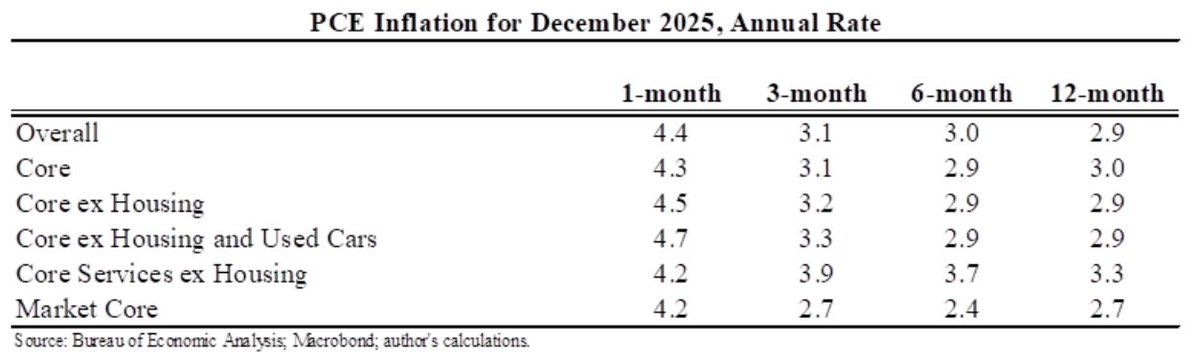
 Here is percentage job growth across sectors over the last year. Dropping the two most extreme they range from 0.8% for leisure & hospitality to -1.5% for information, a 2.2pp difference.
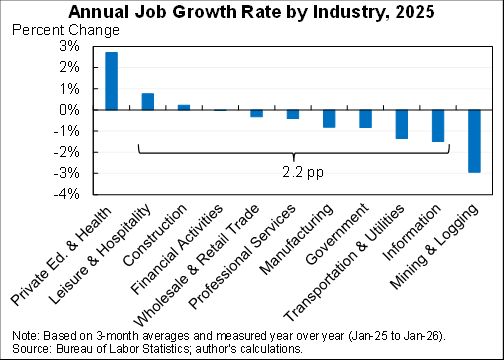
 Here are the full numbers. Sadly no data for October because of shutdown so can't compute 3 month changes.
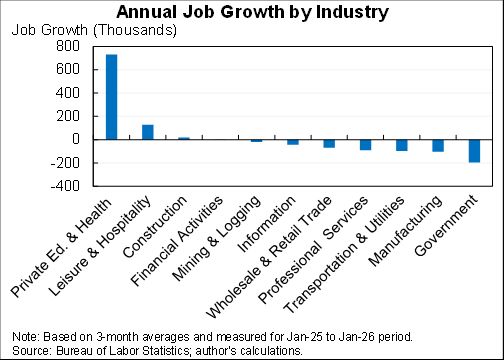
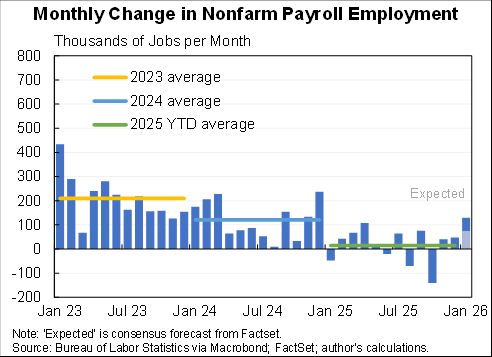 The job growth happened despite further cuts in federal jobs. Private employment was up an impressive 172K.
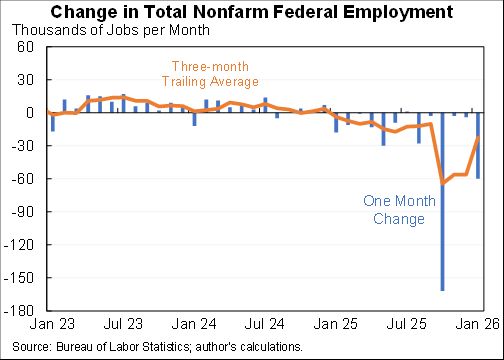
 I've talked to numerous colleagues & students about grade inflation. Almost all of them see it as a a problem. I've also heard about as many different ideas for solutions as I've had conversations. I would tweak this proposal in various ways. But would support it over nothing.
 Here are the full set of numbers.
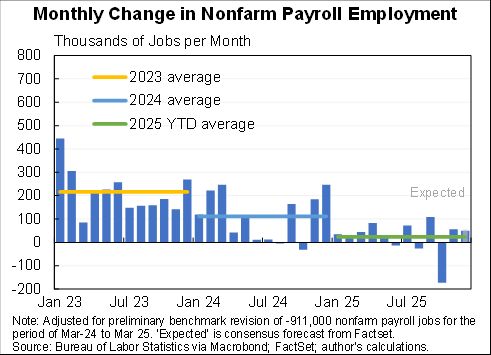 Private sector job growth is a better read of the underlying economic signal.
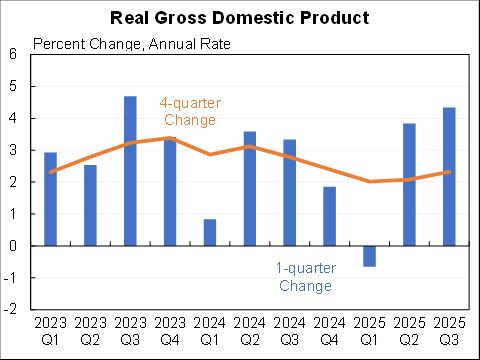 A big part of the story was consumer spending up at a 3.5% annual rate. Started the year looking weak but new data and revisions have made consumers very strong.
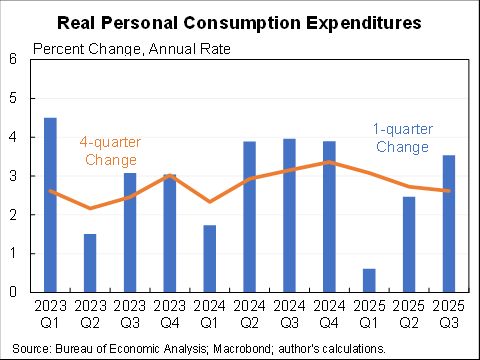
 Full set of numbers.
 1. They claim price controls are good politically. I'm very open to this being true, I'm under no illusion that what I think is good policy is particularly well correlated with good politics. But I am genuinely interested in more evidence beyond the brief observations they make.
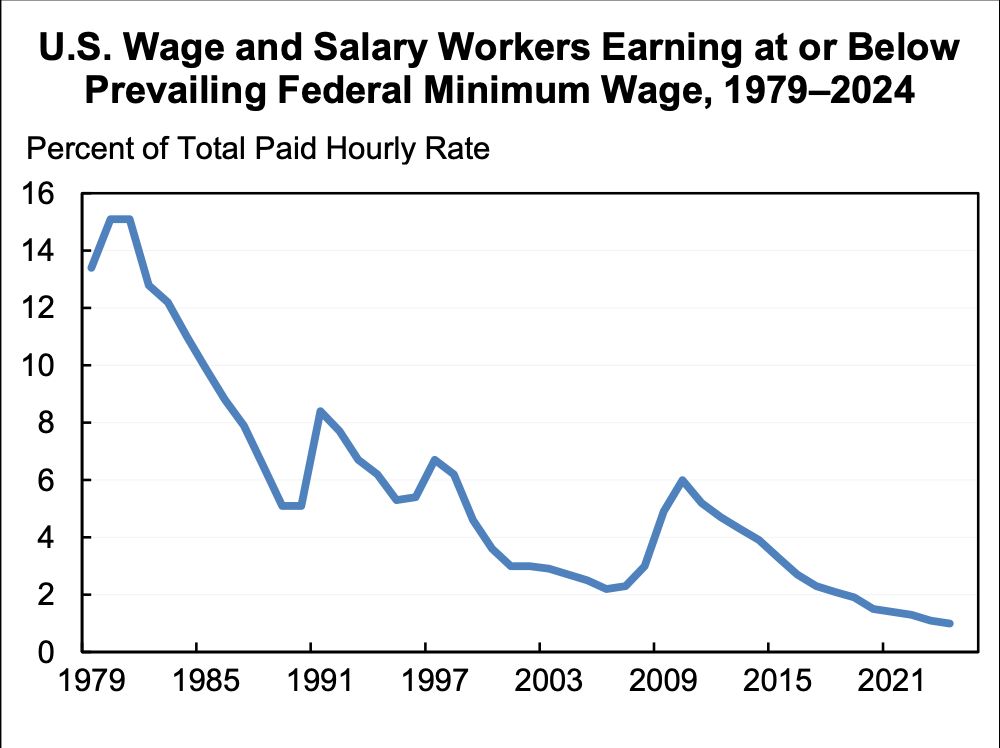 The last three legislated increases in the minimum wage were bipartisan:
 Here are the full set of numbers.
 Here is quarterly consumer spending. It looked like it was really slowing but with this upward revision and the July and August indications it's looking much more healthy.
 Here are the full set of numbers.