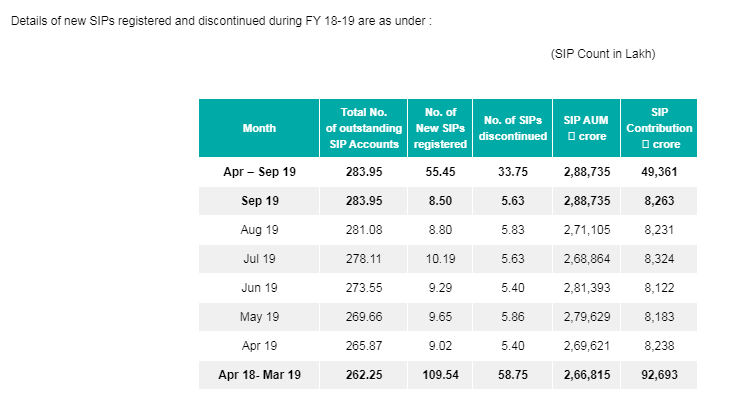
Mutual Fund SIPs accounts stood at 2.84 CRORE! And the total amount collected through SIP during September2019 was ₹8,263 crore 

The Total #SIP Aum is now 2.88 lakh crores and 2.84 cr #SIP accounts. AMFI data shows that the MF industry had added, on an average, 9.24 lacsSIP accounts each month during the FY 2019-20, with an average SIP size ofabout ₹2,900 per SIP account.
Abt 13% of the retail investors chose to invest directly, while 22% of HNI assets
were invested directly.43% of the assets of the mutual fund industry came directly.A large proportion of
direct investments were in non-equity oriented schemes where institutional
investors dominate
were invested directly.43% of the assets of the mutual fund industry came directly.A large proportion of
direct investments were in non-equity oriented schemes where institutional
investors dominate

The proportion of direct investments in equity to the total assets held by
individual investors, was about 9% in September 2019. #direct
individual investors, was about 9% in September 2019. #direct

There are 85,626,244 accounts in the
mutual fund industry as at September
2019, of which 89.9% is accounted for by
retail investors.
There were:
• 76,984,535 Retail investor accounts
• 7,934,070 HNI accounts
• 707,639 Institutional investor accounts.
mutual fund industry as at September
2019, of which 89.9% is accounted for by
retail investors.
There were:
• 76,984,535 Retail investor accounts
• 7,934,070 HNI accounts
• 707,639 Institutional investor accounts.

Since December 2014, there is an increase in investor accounts from 4.03 cr to 8.56
cr in September 2019
cr in September 2019

The average ticket size for equity oriented funds is Rs.122,792.
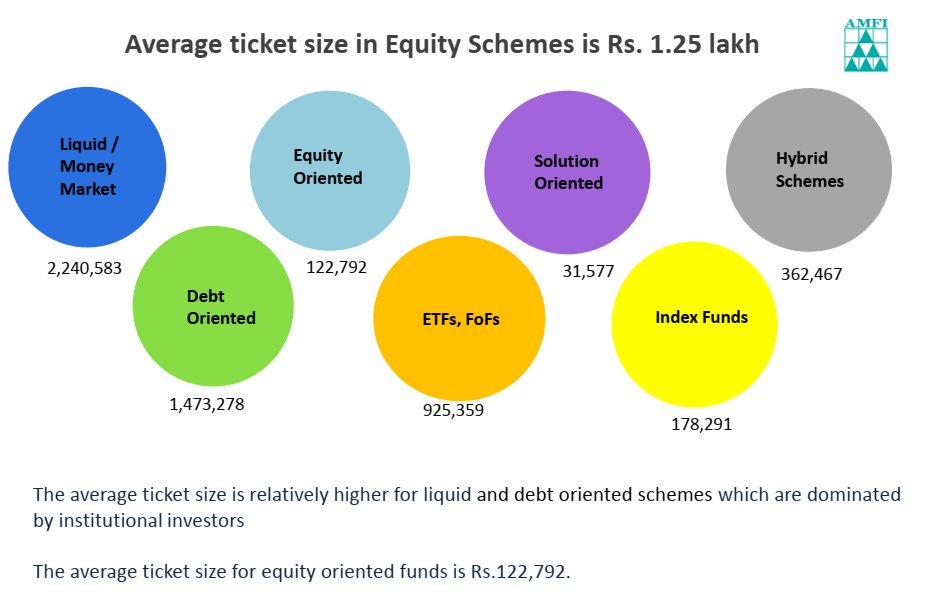
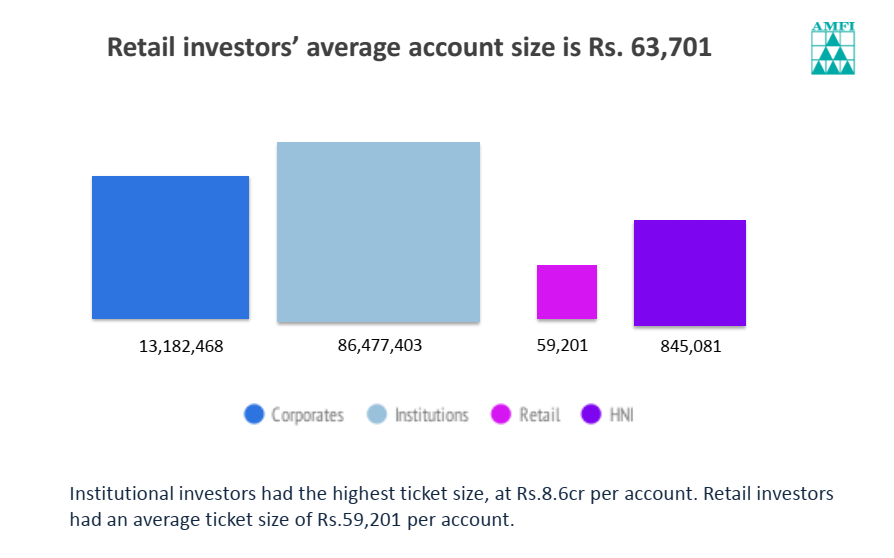
Institutional investors had the highest ticket size, at Rs.8.6cr per account. Retail investors
had an average ticket size of Rs.59,201 per account.
had an average ticket size of Rs.59,201 per account.
Equity assets have a longer average holding period as compared to non-equity assets. 35% of
equity assets have been held for periods greater than 24 months.
equity assets have been held for periods greater than 24 months.

61% of the assets of Individual
investors are from T30 cities,
brought in by distributors.
Direct investments amount to
19% of individual assets, divided
as 3% from B30 and 16% from
T30.
investors are from T30 cities,
brought in by distributors.
Direct investments amount to
19% of individual assets, divided
as 3% from B30 and 16% from
T30.

• • •
Missing some Tweet in this thread? You can try to
force a refresh