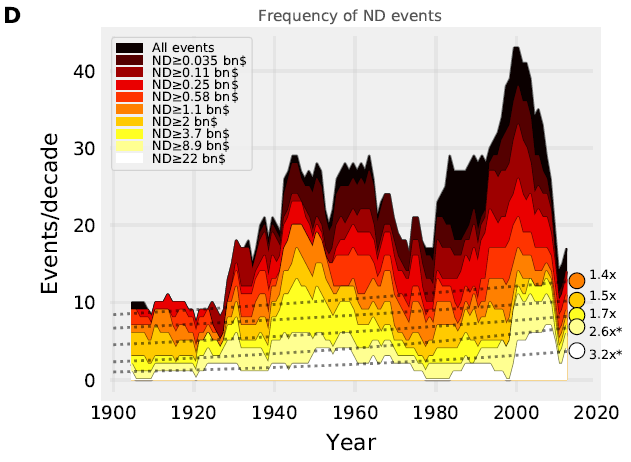
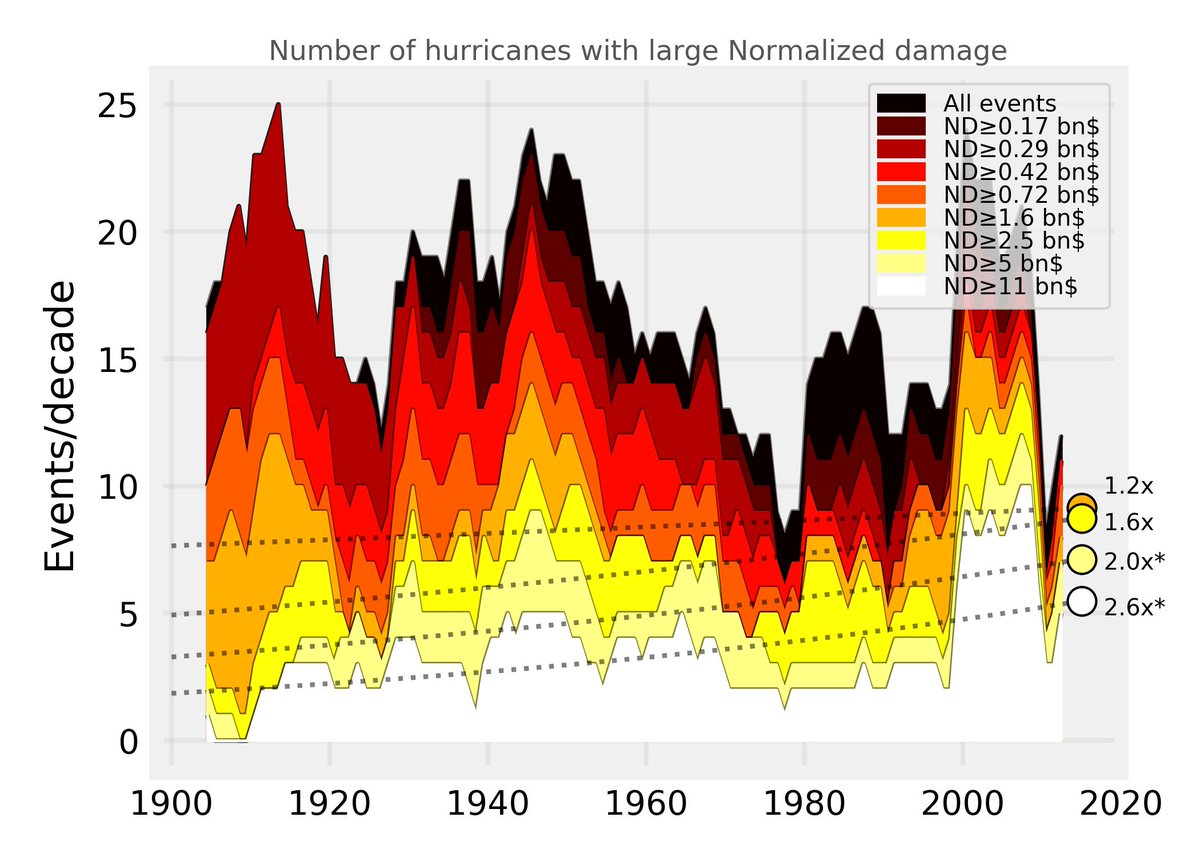
The largest hurricane damage events are getting more frequent. -Also in the Weinkle&PielkeJr et al. normalized damage estimates. 

They argue that some small events are missing in the early part of the record, -they guestimate their ND value. Unfortunately we can see that this has a profound effect on the distribution which looks sick (pre-1940, ND<1bn).
It is not surprising that the early part of the record looks strange. E.g. They use the damage from "Claudette 2003" to fill-in the missing values for 18 other storms.
Weinkle&PielkeJr et al. are unable to see the trend. But is that really convincing when there they have left so much room for investigator bias creep in:
1) Base damage adjustments are different between icat and Weinkle.
2) How do you estimate values for early storms? What category were they, do you account for population density?
3) Choosing a statistical tool that has a very low chance of detecting the trend. (LSQ trend)
2) How do you estimate values for early storms? What category were they, do you account for population density?
3) Choosing a statistical tool that has a very low chance of detecting the trend. (LSQ trend)
So:
1) They have reduce damages of recent events compared to ICAT.
2) They add a bunch of poorly justified damage guestimates to the early part of the record.
I.e. they effectively subtract from one end of the time series and add to the other.
1) They have reduce damages of recent events compared to ICAT.
2) They add a bunch of poorly justified damage guestimates to the early part of the record.
I.e. they effectively subtract from one end of the time series and add to the other.
et voilà: The trend has dissappeared (atleast with that ill suited statistical tool). -It does not fill me with confidence when there is this much room for investigator bias.
The fireplot with the frequency of events over threshold is better because you can simply disregard small events when you think they might be biased. It is also very easy to replicate.
I want to stress that when I say "investigator bias" then I am not accusing Weinkle et al. of being more biased than any other scientist. I have no reason to suspect that they are not honest, and I expect they can rationalize every processing step. (Fixed tweet to be more clear)
My problem is the wiggle room given to expert judgement that can directly influence trends.
• • •
Missing some Tweet in this thread? You can try to
force a refresh