Joshua Saxe Profile picture
Jan 24, 2020 10 tweets 4 min read Read on X
1/ Here's a thread on how to build the kind of security artifact "social network" graph popularized by @virustotal and others, but customized, and on your own private security data. Consider the following graph, where the nodes are malware samples:
2/ What you're seeing are relationships between samples from the old Chinese nation-state APT1 malware set provided by @snowfl0w / @Mandiant (fireeye.com/content/dam/fi…). The clusters are samples that appear to share C2, based on the kinds of relationships shown in the image here:
3/ In graph vocab, the object above is known as a "bipartite graph", which has the following structure: there are two sets of nodes, malware samples and domains, and nodes in either set can only connect directly to the *other* set.
4/ Bipartite graphs apply almost everywhere when graphing security relevant relationships. Think about it: domains relate to each other *indirectly* by way of the CIDR blocks / ASNs they reference. Email attachments relate to one another by way of their sender domains.
5/ And malware samples can also relate to each other, say, by the desktop icons they use, as in this image. This is also a bipartite graph.
6/ Beyond bipartite graphs, it's also common to analyze security artifacts' similarity relationships via similarity measures like the Jaccard index. This measures the Venn diagram-like overlap between samples' low-level features (e.g. CPU instructions and strings).
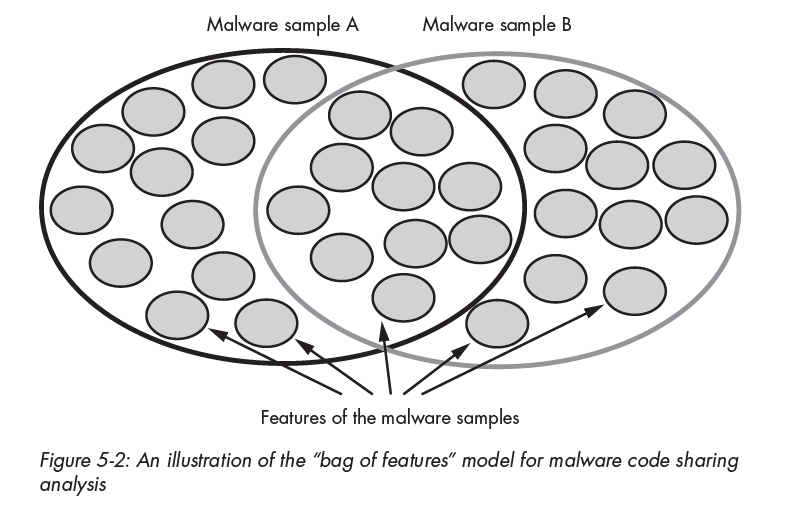
7/ Here's a comic-book like figure showing how the Jaccard index computes out when comparing 4 different pairs of malware samples. You compare two samples' Venn diagrams and get a value between 0 and 1. This style of analysis involves computing Jaccard over all pairs of samples.
8/ You can threshold Jaccard index similarity relationships, and then make a link between pairs of samples that have a Jaccard index above that threshold. This yields attractive, useful graphs, like this one, of the APT1 malware dataset shown above.
9/ Hopefully this has whet some appetites for security network analysis. "networkx" is by far the best Python tool to do this kind of graph analysis, and it allows you to export data so that you can visualize it with d3.js and graphviz. I used graphviz for the figures above.
10/ My thread here isn't intended as a plug for @hillarymsanders and my book, but it is derived from our book "Malware Data Science."

• • •

Missing some Tweet in this thread? You can try to force a refresh
 

Keep Current with Joshua Saxe

Joshua Saxe Profile picture

Stay in touch and get notified when new unrolls are available from this author!

Read all threads

This Thread may be Removed Anytime!

PDF

Twitter may remove this content at anytime! Save it as PDF for later use!

Try unrolling a thread yourself!

how to unroll video
  1. Follow @ThreadReaderApp to mention us!

  2. From a Twitter thread mention us with a keyword "unroll"
@threadreaderapp unroll

Practice here first or read more on our help page!

More from @joshua_saxe

Jul 23, 2024
With today’s launch of Llama 3.1, we release CyberSecEval 3, a wide-ranging evaluation framework for LLM security used in the development of the models. Additionally, we introduce and improve three LLM security guardrails. Summary in this 🧵, links to paper/github at bottom: Image
CyberSecEval 3 extends our previous work with several new test suites: a cyber attack range to measure LLM offensive capabilities, social engineering capability evaluations, and visual prompt injection tests. Image
Our cyber attack range assesses an LLM's ability to perform offensive cybersecurity tasks such as reconnaissance, exploitation, and post-exploitation from a Kali linux staging box. For Llama 3.1, the model does not reach a dangerous level of capability in these areas. Image
Read 11 tweets
Aug 13, 2023
Making this deck for my Defcon AI Village keynote took an inordinate amount of time because it meant publicly murdering my darlings: the ~80% of MLsec R&D efforts I worked on over ~10 years and which never reached deployment🧵 Image
And I guess it meant more: admitting that on many of these projects I could have seen the end before I started had I really admitted the hard limits of 2010’s era machine learning. Image
2010’s machine learning turned out to have one great killer security app: detecting mass produced cyberattacks for which we had a lot of training data and a lot of labels. This is the one application of many tried which avoided the tech’s basic limitations. Image
Read 6 tweets
Nov 17, 2020
How to evaluate a cybersecurity vendor's ML claims even if you don't know much about ML (thread).

1) Ask them why they didn't solely rely on rules/signatures in their system -- why is ML necessary? If they don't have a clear explanation, deduct a point.
2) Ask them how they know their ML system is good. Where does their test data come from? How do they know their test data is anything like real life data? How do they monitor system performance in the field? If their story isn't convincing, deduct a point.
3) Ask them where on Wikipedia you can read more about the approach they took. If you can't read about it on Wikipedia, ask them where their paper is in the peer-review and on arXiv. If the paper doesn't exist / is a "trade secret", deduct 3 points
Read 10 tweets
Jan 28, 2020
1\ Surprisingly, you could build a very mediocre PE malware detector with a single PE feature: the PE compile timestamp. In fact, I built a little random forest detector that uses only the timestamp as its feature that gets 62% detection on previously unseen malware at a 1% FPR.
2\ The timestamp field poses a low-key problem for attackers. If they leave the compiler-assigned value they reveal telling details. If they assign a concocted value, their tampering can make them easier to detect. Here's an 'allaple' malware set's random, insane timestamps:
3\ Now let's look at a big malware dataset's compile timestamp behavior. Notice the straight horizontal lines. Those are unique polymorphic hashes reusing the *same* compile timestamp month after month. Also, notice the number of insane back-to-the-future timestamps.
Read 6 tweets
Jan 2, 2020
Thread on cognitive biases in cybersecurity I've noticed:

Maginot Line: you got breached by an impersonation attack, so you go buy an anti-impersonation solution and assume you're much safer. Sort of like checking people's shoes at the airport.
Survivorship/reporting bias: You treat statistics on breaches that have been reported publicly as representative of the threat landscape, when the most successful breaches go undetected.
Just-world bias / moral luck bias: you believe org X's security failings are uniquely terrible because they got publicly breached, even while other orgs with similar postures (including yours) haven't been breached, simply due to luck.
Read 9 tweets

Did Thread Reader help you today?

Support us! We are indie developers!


This site is made by just two indie developers on a laptop doing marketing, support and development! Read more about the story.

Become a Premium Member ($3/month or $30/year) and get exclusive features!

Become Premium

Don't want to be a Premium member but still want to support us?

Make a small donation by buying us coffee ($5) or help with server cost ($10)

Donate via Paypal

Or Donate anonymously using crypto!

Ethereum

0xfe58350B80634f60Fa6Dc149a72b4DFbc17D341E copy

Bitcoin

3ATGMxNzCUFzxpMCHL5sWSt4DVtS8UqXpi copy

Thank you for your support!

Follow Us!

:(