Scott Irwin Profile picture
Jan 30, 2020 9 tweets 4 min read Read on X
1. So just how bad were ethanol losses in 2019? My personal take---losses were real but maybe not as bad as many think.
2. My estimated annual profits for a representative Iowa ethanol plant over 2007-2019. I updated my model this year to recognize efficiency gains in ethanol and DDGS conversion since 2015. So profits are higher since 2015 than what I published previously. Image
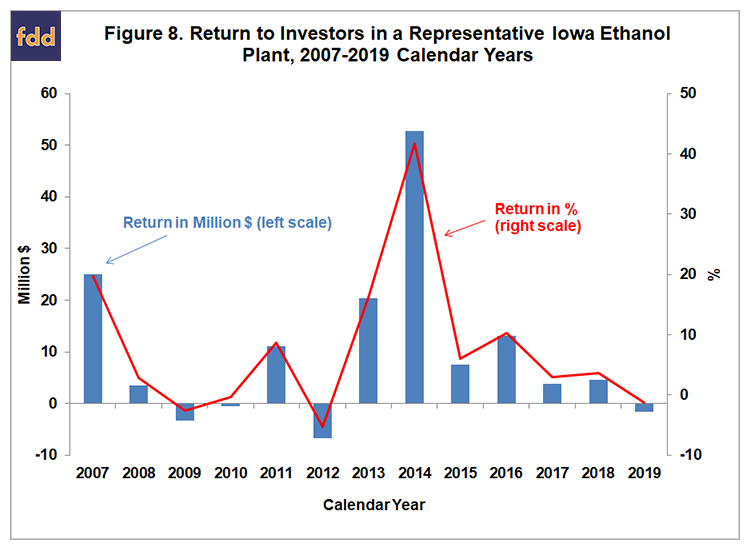
3. 6 straight years of annual profits over 2013-2018. So the loss in 2019 was a bummer. My estimate is an average plant lost $1.6 million in 19. Still, trendline for profits in last three years is troubling. Small profit or loss. Image
4. This chart really shows just how difficult times were last summer for ethanol plants. Ethanol prices came within a dime of the shutdown price for a representative plant. Image
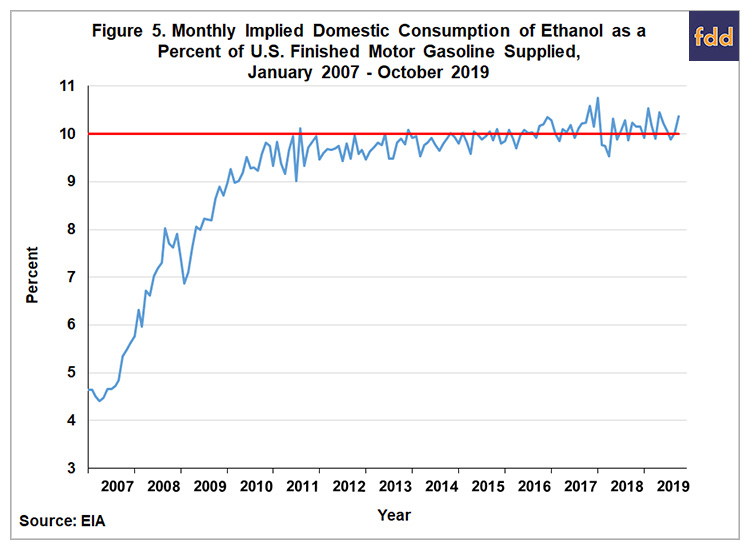
5. So, why were times so tough for ethanol producers in 2019? Headlines seem to all focus on #SREs and #RFSwars. Vast majority of ethanol used in E10. Still don't see any decline in aggregate US blending rate for ethanol. So I don't think it was SREs. Image
6. Could the blending rate for ethanol in 2019 been much higher without SREs? May have ticked up a little bit, but hard for me to see how that would have made much difference. I still think removing SREs mainly benefits biodiesel. Image
7. Here is what I think is one of the main culprits for ethanol losses in 2019. Ethanol trade really went backwards in 2019. Exports down 206 mg so far in 19 and imports up 134. Net exports dropped 340mg. Probably end up over a 400mg drop. Significant swing factor. Image
8. Second major factor was continued growth in efficiency of ethanol production. Conversion rate surged in 2019 towards 3 gallons of ethanol per bushel of corn. Impressive but extra supply when not needed by the market. Image
9. Can things turnaround in 2020 for ethanol producers? Need some help on the export side from Brazil and China. I don't see a turnaround with Brazil, which means ethanol producers have a lot riding on China following through on the Phase 1 trade agreement purchases.

• • •

Missing some Tweet in this thread? You can try to force a refresh
 

Keep Current with Scott Irwin

Scott Irwin Profile picture

Stay in touch and get notified when new unrolls are available from this author!

Read all threads

This Thread may be Removed Anytime!

PDF

Twitter may remove this content at anytime! Save it as PDF for later use!

Try unrolling a thread yourself!

how to unroll video
  1. Follow @ThreadReaderApp to mention us!

  2. From a Twitter thread mention us with a keyword "unroll"
@threadreaderapp unroll

Practice here first or read more on our help page!

More from @ScottIrwinUI

Mar 20
1. I guess today is the day to talk about corn yields. Just received an email from @aaea announcing a new Choices article "A Slowdown in US Crop Yield Growth" by David Boussios. Here is the link: choicesmagazine.org/choices-magazi…
2. The author of the Choices article argues: "The statistical evidence of a productivity slowdown in crop yield growth builds each year. The linear yield growth trends since 2013 for corn, soybeans, and wheat are all statistically lower than one starting in 1988. Models, forecasts, market participants, and policy makers should consider that yields in the future will probably be lower than forecasted by the USDA and that extrapolating trends into the future without revision is problematic."
3. This argument is especially interesting because I have seen similar arguments in the grain trade in the last few years. We can all agree that the US average corn yield has been relatively flat since around 2013. That is obvious looking at a chart of corn yields. But one has to be extremely careful in then leaping to the conclusion that productivity growth in corn yields has also slowed. The reason is that runs of poor or good weather can mask the true underlying trend in small samples of years.
Read 7 tweets
Nov 1, 2023
1. Recommended Reading for the Day: Fascinating new FDD from my colleagues on the farmdoc team, led by Carl Zulauf. Long-term look at real crop prices. farmdocdaily.illinois.edu/2023/10/the-po…
2. It has long been a staple of economic thinking that real (inflation adjusted) commodity prices have a strong tendency to decline over time. Probably the most famous example of in this regard is the bet about real commodity prices between Julian Simon and Paul Ehrlich in 1980. See the details here:
3. Carl and team put together the data for a USDA index of real crop prices going back to 1912. This is the chart shown below. Lots of interesting history here, but the 30 year period of stable real crop prices that began around 1990 is unmistakable. The question is whether this is a pause in a very long run downward trend or something new.
Image
Read 8 tweets
Sep 28, 2023
1. Excited to announce that the band is back together! Actually, talked Darrel Good into coming out of retirement to work on this FDD: "The New Era of Crop Prices: A 15-Year Review." farmdocdaily.illinois.edu/2023/09/the-ne…
2. When crop prices started to take off in 2006-07, a huge question was whether this was just another spike like we had seen so many other times, or was this the beginning of a permanent jump in the level of average prices, like in 1973. Image
3. For some reason (temporary insanity?), Darrel and I decided to stick our necks out and predict that a new era in crop prices was afoot AND make specific predictions for the average price and trading range in the new era. As this chart shows, we did not have much data to go on.
Image
Read 8 tweets
Jun 1, 2023
1. Ok, I have hopefully convinced you that the RIN cliff scenario is a logical possibility. Now what are the chances of it actually happening? The first step is to estimate QM in the graph below. Turns out the proposed RVOs released by EPA last December are the place to start. Image
2. We can use the proposed RVOs to come up with a defensible estimate of the maximum demand for biomass-based diesel (BBD) for 2023, 2024, and 2025. We can do this because we know mandates are and will be binding. Image
3. I will leave the details of the computations to the article. Suffice it to say that under the EPA's preliminary rulemaking, the max amount of BBD needed is about 4BG each year. That is national demand for sum of RD and BD. Image
Read 11 tweets
Jun 1, 2023
1. Ok, had to take a brief pause for the cause (a meeting). Anyway, diving into the heart of the RIN cliff idea in this thread based on our latest FDD. farmdocdaily.illinois.edu/2023/05/is-the…
2. Here is how RIN pricing works when BBD production is equal to the mandated quantity. In this case, looking at an example of D4 biodiesel RIN pricing on May 4, 2023. Predicted D4 RIN price is $1.61 and actual on this date is $1.58. Pretty close. Everything A OK. Image
3. But what if for some exogenous reason, biomass-based diesel (BBD) production is pushed past the RFS mandate? This is the RIN cliff scenario. New market equilibrium is given by intersection of demand w/tax credit and fixed QRC supply of BDD. Red line becomes supply curve. Image
Read 8 tweets
Jun 1, 2023
1. Our latest FDD on the renewable diesel boom is titled "Is the U.S. Renewable Fuel Standard in Danger of Going Over a RIN Cliff?" That should get your attention this morning. It is going to take me several twitter threads to go through the highlights.

farmdocdaily.illinois.edu/2023/05/is-the…
2. In this thread, I am going to go through the first part of our analysis. Start with the very basics of binding and non-binding RFS mandates. In a standard supply/demand framework, here is a binding mandate. Image
3. A binding mandate "binds" in economic terms because the mandate volume exceeds the competitive market equilibrium quanitity. To get the higher than equilibrium Q produced, producers have to be offered a higher price and consumers a lower price. Image
Read 9 tweets

Did Thread Reader help you today?

Support us! We are indie developers!


This site is made by just two indie developers on a laptop doing marketing, support and development! Read more about the story.

Become a Premium Member ($3/month or $30/year) and get exclusive features!

Become Premium

Don't want to be a Premium member but still want to support us?

Make a small donation by buying us coffee ($5) or help with server cost ($10)

Donate via Paypal

Or Donate anonymously using crypto!

Ethereum

0xfe58350B80634f60Fa6Dc149a72b4DFbc17D341E copy

Bitcoin

3ATGMxNzCUFzxpMCHL5sWSt4DVtS8UqXpi copy

Thank you for your support!

Follow Us!

:(