Couple of charts from latest RBC Housing Market Commentary, this one titled "Are Toronto home prices sky-bound again?"
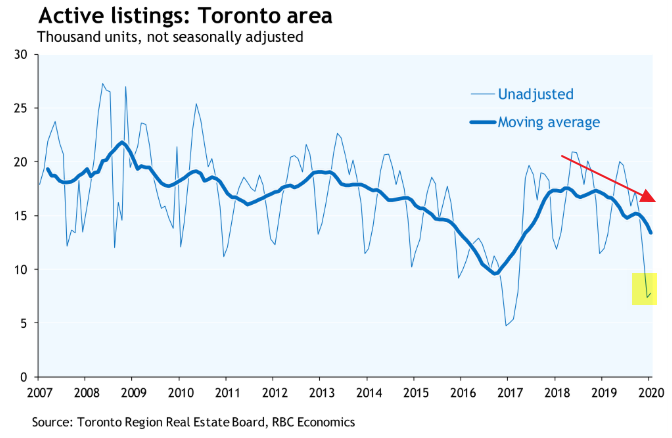
First, GTA inventory at second lowest Jan level in this 14 year look. Second, rolling 12 month avg trending down. /1
Vancouver almost out of negative YoY HPI ditch. Toronto's has crept up to almost 10% on the composite benchmark. On the chart 10% doesn't look as high as it should, just due to peaks of >30% for Toronto and #VanRE back in 2016 and 2017. /2
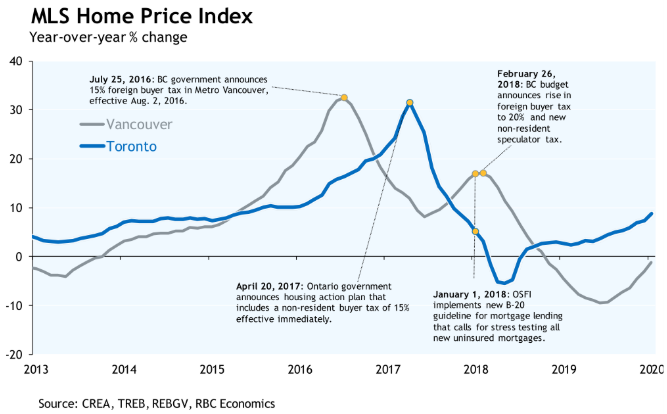
Some strong words: "It’s looking more and more like early-2016 all over again for the Toronto housing market. This is not a good sign. Those were the days when things started to heat up uncomfortably, propelling property values sky-high in the ensuing year." /3
Here's a rental eviction story a friend of mine is letting me share, from the N12 notice (family member) to the recently concluded LTB hearing. So grab a ☕️, sit back 🪑, and read this 🧵 to see the outcome. /1
July 2020 - "I texted him at 9:30am asking about cockroaches I had seen in the apartment in the last few weeks.. he replied a few hours later asking me if the type and let me know his mom would be moving in.. all in the same message with the 🙏at the end. Next day sent N12." /2
He'd lived there 9 YEARS.
"I had a feeling it was bullshit but really what could I do with no proof.. I was tempted to stay and wait for it to get tied up in the LTB, some part of me believed it was possible he was being truthful."
Since CBC Marketplace likes investigating, I thought I'd do my own investigation on the house in the Real Estate "exposé" that aired last night, which centered around this house in Vaughan. Here's a bit more info for you in this 🧵/1
The owner was complaining about how they listed on the MLS offering to pay 1% commission to the "co-operating brokerage" (buyer's agent), which is short of the more common 2.5% commission offered in the GTA market. She claimed that agents were "steering" their clients away. /2
The CBC investigation with the large sample size of 3 agents, found 2 of them appearing to discourage their buyers (don't know if they were actually clients because they didn't mention if they'd actually signed Buyer Representation Agreements, which is no small matter). /3
So CBC is running a show tonight (which I'm PRVing). Here's the article previewing it. I got emails this afternoon from TRREB and OREA about it this aft, so it might be getting some play.
Here's the Sept 2nd RECO bulletin referred to by TRREB above, and in the article where it said RECO "issued a notic ice about steering to the over 93,000 real estate agents, brokers and brokerages under its purview." /3
TRREB has released its September #torontorealestate numbers. They like to accentuate the stats that would indicate everything is awesome, but let me point out 5⃣ STATS SHOWING MARKET COOLING ❄️ /1
First let me say it's not a COLD market yet by any means. But problem is everyone just likes to look at YoY change. When you think about it, 12 months is a somewhat arbitrary period to compare to. So September sales are way ⬆️(42%) and average prices are also ⬆️ (14%) /2
1⃣ AVERAGE YoY PRICE GROWTH IS SLOWING.
In July it was +16.9%
In August it was +20.1%
In September that slowed right down to +14.0%
Note a good chunk of the price growth is due to mix (less condo apts, more detached). /3
Some weekly #torontorealestate sales numbers in this thread. Firstly, week over week pattern this year continued to follow same as last year (only couple of deviations on here, main one being Labour Day one week later this year). /1
The total sales in the 416 in the past 4 weeks cumulative have been just 1% below 2019, with this week being flat. /2
But "tale of two cities" continues, with freehold (lowrise houses) selling stronger than last year and condos (apts and townhouses combined) selling weaker of late (and didn't show the huge "pent-up demand" that houses did. /3
Bonus Tuesday #torontorealestate chart content. Here's an update weekly 416 sales year-over-year. Can see how unusually down was during COVID, then unusually up when things started re-opening. Spike week ending 9/6 was b/c normal week this year but Labour Day week last year. /1
Reverse is true for week ending 9/13 (includes Labour Day this year). That blue line was condo and freehold combined. This is separated. Can see the big YoY sales increases really driven by freeholds. /2
Here's a look at the absolute numbers underlying the freeholds. Post-June is consistently higher than last year. /3