
Data-driven former CPA, CA and current Toronto REALTOR® offering balanced views of the market — not an "only goes up" industry hype man
 The week-over-week (w/w) change was ⬆️428 listings for Freeholds (houses). Below's the equivalent week in the last 7 years. Usually the weeks leading up to and including Labour Day ⬇️w/w and then things start to grow.
 The owner was complaining about how they listed on the MLS offering to pay 1% commission to the "co-operating brokerage" (buyer's agent), which is short of the more common 2.5% commission offered in the GTA market. She claimed that agents were "steering" their clients away. /2

 First let me say it's not a COLD market yet by any means. But problem is everyone just likes to look at YoY change. When you think about it, 12 months is a somewhat arbitrary period to compare to. So September sales are way ⬆️(42%) and average prices are also ⬆️ (14%) /2
 The total sales in the 416 in the past 4 weeks cumulative have been just 1% below 2019, with this week being flat. /2
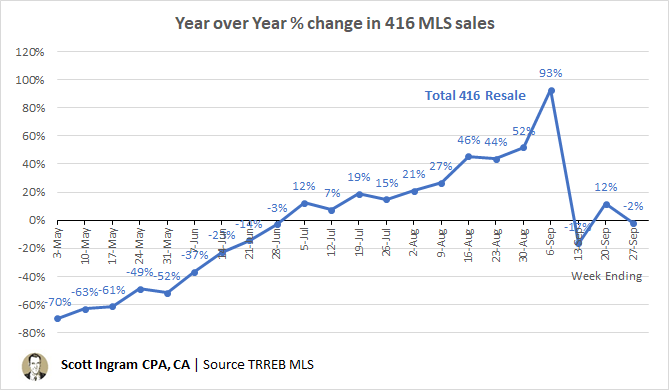 Reverse is true for week ending 9/13 (includes Labour Day this year). That blue line was condo and freehold combined. This is separated. Can see the big YoY sales increases really driven by freeholds. /2
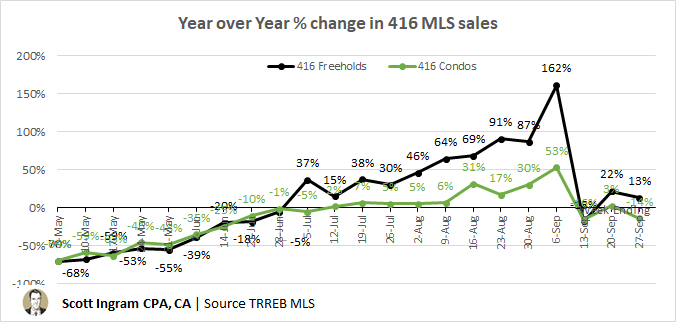
 Last year, condos peaked the week before this one and then declined each week until January. Not sure when active listings are going to stop growing this time. At least it's slowing down a little. Added 179 last week. Average for 19 weeks preceding was +200. /2
 FOR LEASE: DT is 62% of active listings and 58% of leases in last 30 days. For all talk about terrible rental market, it's not like leases have stopped. Has been nearly 3800 in last 30 days. Might be some people shuffling from A to B to take advantage of lower rents. /2
 Same in 20% over asking. Strongest numbers since 2016 for last 3 months. I track this as one indicator of market heat 🔥. In years I've tracked, the peaks for these stats have coincided with frothiest periods (spring 2017 (red), Feb/Mar 2020), and drops in uncertain times. /2
 The following two charts are on the same scales. Amount of 30+ day listings are in the same ballpark, but you can see percentage of "fresh" listings is a lot higher on Freehold (30.6% vs. 23.8%). /2


 If you're curious to flip through some, the @torontolibrary has many of them digitized. You can look up addresses and see who lived there or what company was there, or names and see what their occupations were. /2
 Condos sales are up, but not to degree of freeholds (21% vs. 66%). /2
 Condos: They're growing! Still. Huge boost in "fresh lettuce" (green) in the last week, but some might be re-listings. /2


 Most interesting development for me was rolling 30 days of sales jumped a lot for freeholds & condos last week. First week of Sept much strong than first week of Aug. So MOI decreased for both ownership types.
 Active listings climbing, but bigger picture (moving avg) is still lower levels than most of last 13 years. /2
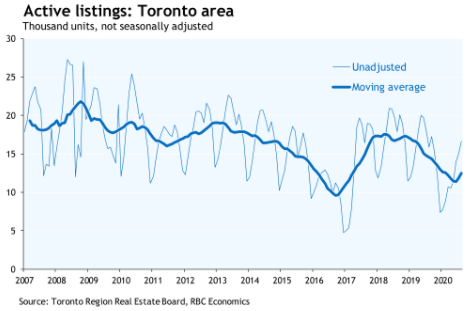
 So the came out with a new stat.
 But note sales are ⬇️3% from July so looks like some of that pent-up demand is out of the system now.

 Was lowest week-over-week gain in 416 condo inventory since beginning of May. /2