Watching futures...anything can change by morning but taking that into consideration, still looks like a B, Now needs a slight modified count. Basically the same pattern though
Slightly bigger picture
And finally, one more possibility. This one looks more likely now, especially given current status and all the similarities.
ATH are definitely in at this point. Nothing goes straight down though and we should see some big bounces in between large declines.
There are going to be a lot of huge moves overall and timing price can get tricky. Not hard to be off by a lot considering the size of the pattern.
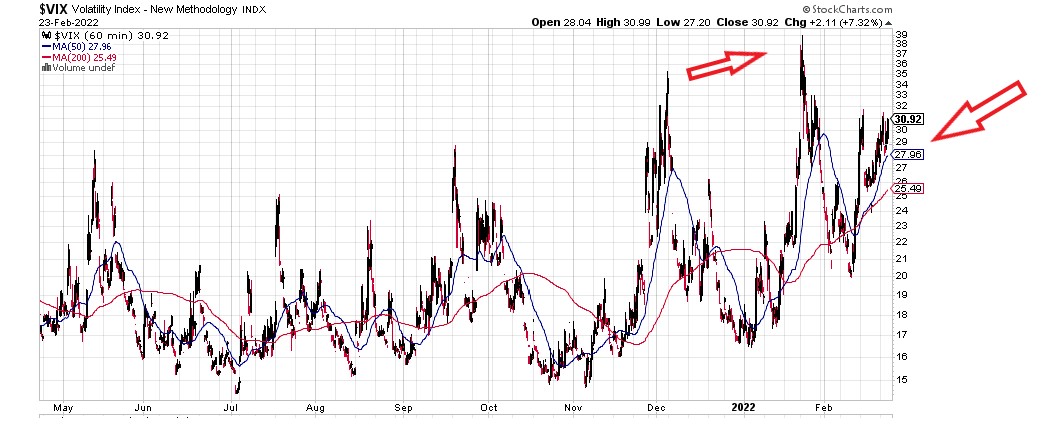
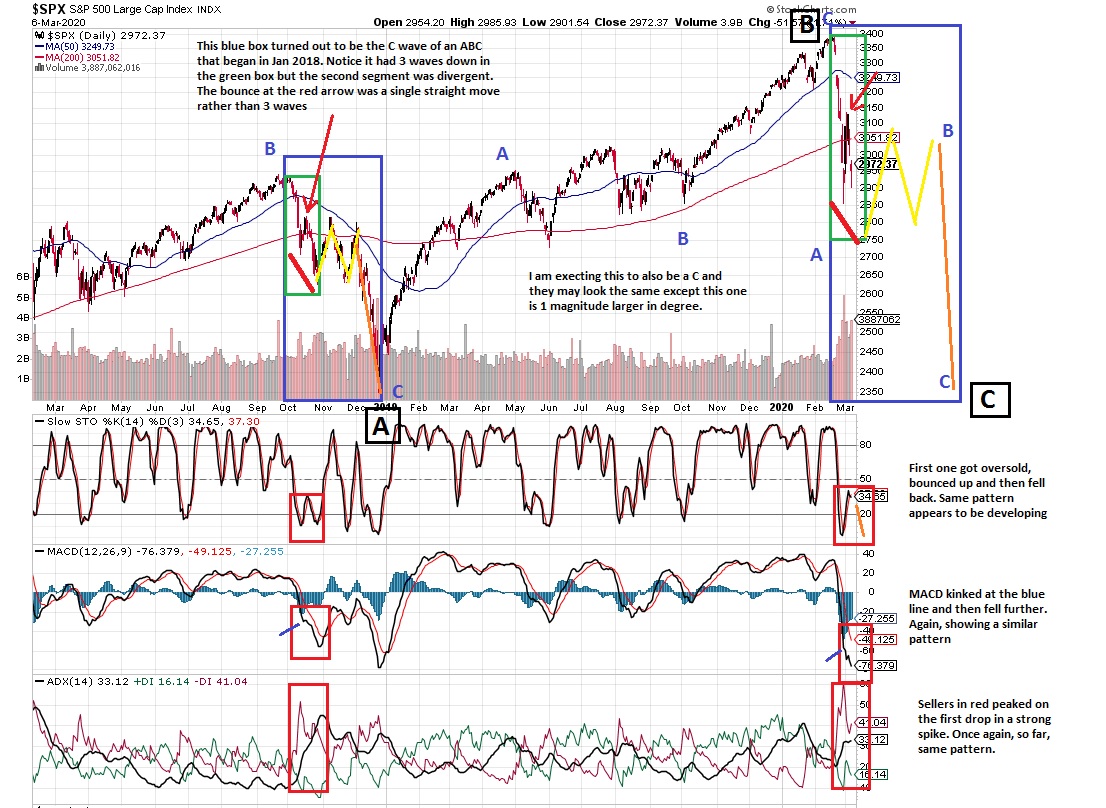
Here's more detail on why I think the C wave between Oct-Dec 2018 looks a lot like the one now. They have very similar parts, patterns, gaps, not just in price but on indicators too.
So I actually think this is now the most likely path given all the parallels.
In 2018, the second leg was 0.91 in price compared to the first. Assuming the same, the first leg down from 3390 to ~2860 was about 530 pts. x0.91 gives us 482 off the recent peak ~3130 to target 2650. Decent chance we see this by Tuesday.
Strong bounce to follow and one more lower low maybe to ~2630 which happens to be 200 week MA and also the lower channel line on my ABC-X-ABC from 2009. Nice...
• • •
Missing some Tweet in this thread? You can try to
force a refresh
1/ Despite this being the most "telegraphed" invasion over the last two weeks, I think market responses are different and given the last 2-3 days, I can potentially see why. The implications are global and longer term.
2/ The US response has been weak and practically non-existent. #1, this gave Putin the go-ahead having nothing to fear. #2, China is watching, I guarantee. If the US response to this is pathetic, you can bet, this gives them the go-ahead for full Taiwan and Hong Kong take over.
3/ Sadly, this has the possibility of triggering something major, yes like WW3 in a cascading affect. God help us....
2/ In Sept/Oct 2020, the market created an ABC corrective and then took off on a tear. Top of that white candle off the low is 3272. WE NEVER filled that gap. Coincidence?
3/ Still playing with numbers...but Timing analysis puts ~Mar 11 as the low, ~3274 if it plays out. In a waterfall decline, the worst comes at the end as the drop slowly accelerates. The boiling frog comes to mind.
4/ Vix is rather tame so far given what has transpired over last few days. NO PANIC relative to what we saw going into Jan 24.
1/ You get the MMR (measles, mumps, rubella vaccine) at 9-15 months and a booster at 4-6 years. You know how long that lasts? Forever. Covid vaccine doesn't even last 6 months and you already need a 3rd shot as a booster. The truth is right in front of you.
2/ Other vaccines took many, many, many years of clinical trials before being approved. Covid? Less than 6 months for FDA approval. Truth is again right in front of you. There was NEVER any long term testing done and it still does not exist. The mass public is the clinical trial
3/ MMR works on attenuated virus (whole but incapacitated) to stimulate your natural immunity, and produces memory T and B cells so you are protected - we covered this - forever. mRNA is not = virus and doesn't even last 6 months. No memory T and B cells.
1/ Can't help to see how eerily similar the set up is. June 7-9-11 is Major window. Does the centerpoint on 9th finally break? STILL have not closed above May 10 high.
2/ I am not seeing strength here. Potential ending fractal where there is a rally in green and red corrective. However, each "break" results in a substantially weaker rally. The B wave top of each red for first 2 were both gap and crap. Out of room on the last one.
3/ $AAPL Seeing trouble. That's a valid 3 wave corrective bear flag on the right and on falling volume. Possible HS also with falling volume targets 103 on the break. Major market general here could help take down the market.
1/ Chart study from Dragon's Den. Chart posted below on May 28 with current inset on top. So far so good. Another major time zone 6-7 to 6-9/11. Goods odds of drop to black channel ~4140 starting Monday.
2/ Lower black channel is super important so watch carefully. Break that and a slight alternate to above says we're done just in case.
3/ For now, let's assume black channel holds. The fractal pattern posted last week is also holding and that means time for another one of those green zigzags down.
1/ Chart study from the Dragon's Den. Bank index first. $BKX
2/ Weekly. Major RSI spikes catch significant highs and lows leading to pauses or more likely, reversal. Large ABC pattern looks complete. B wave classic flat.
3/ $BKX ABC-X-ABC zigzag since Oct is pretty clean. B waves channel perfectly for textbook structure. Not much more to go.