 3/ Still playing with numbers...but Timing analysis puts ~Mar 11 as the low, ~3274 if it plays out. In a waterfall decline, the worst comes at the end as the drop slowly accelerates. The boiling frog comes to mind.

 2/ I am not seeing strength here. Potential ending fractal where there is a rally in green and red corrective. However, each "break" results in a substantially weaker rally. The B wave top of each red for first 2 were both gap and crap. Out of room on the last one.
 2/ Lower black channel is super important so watch carefully. Break that and a slight alternate to above says we're done just in case.


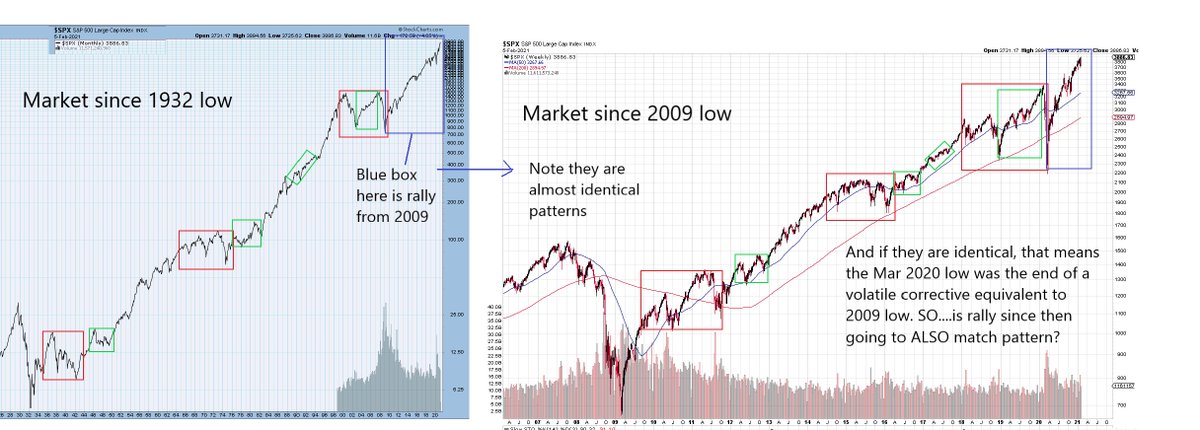 2/ So if nesting, the rally from Mar 2020 low should again be like pattern from 2009. Just one degree smaller. I think it is close.
 2/ That said, this is the final segment in the wedge and there is likely a lot of overlap but no more than 3 clear waves. once gap fills, that may be it so a terminal end is upon us.
 2. After another longer bounce and drop, the total was 40% down. It managed to recover ~62% of that in the months that followed.
 2/ The 3 peaks pattern is the true market nesting pattern. In the last big picture chart, we see that 2000-2009 was a giant ABC corrective. Going one step bigger, 2000 - now is also a giant ABC but we have only just begun the C.
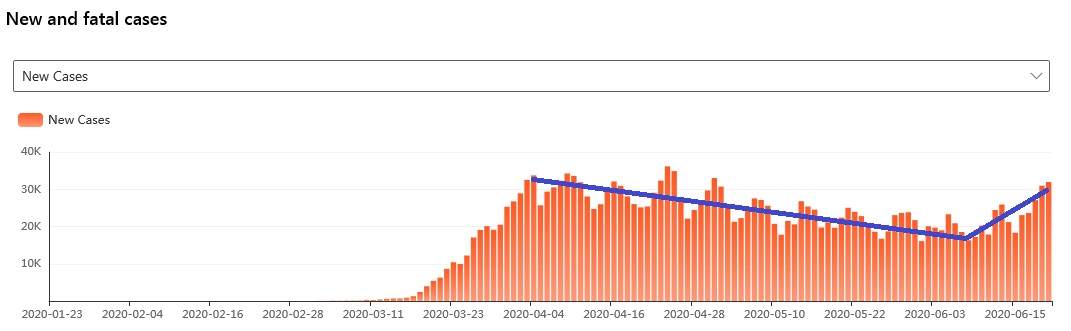 2/ Clearly, shutdowns had the anticipated affect of "flattening the curve". However, Memorial Day was a pivot when the public basically went YOLO and you started seeing mass gatherings, many people without masks
 Full moon June 5th.


 2/ Max would be 2600 if it materializes but unclear if it gets that far. Would be another of those bear market power rallies.
 Using the above, we are then currently moving towards red dot 3 which could be higher or lower low. Another big bounce for green dot 1 and then final low at green dot 2. Again, 2640 must hold.
 Slightly bigger picture
