In a new preprint, @sinabooeshaghi et al. present deep SMART-Seq, @10xGenomics and MERFISH #scRNAseq (37,925,526,323 reads, 344,256 cells) from the mouse primary motor cortex, demonstrating the benefits of cross-platform isoform-level analysis. biorxiv.org/content/10.110… 1/15
We produce an isoform atlas and identify isoform markers for classes, subclasses and clusters of cells across all layers of the primary motor cortex. 2/15
Isoform-level results are facilitated by kallisto isoform-level quantification of the SMART-seq data. We show that such EM-based isoform quantification is essential not just for isoform but for gene-level results. #methodsmatter 3/15
Using the 10xv3 data, we also present the first cross-platform validation of SMART-seq isoform quantification (possible by analyzing transcripts with unique sequence near the 3’ end). 4/15
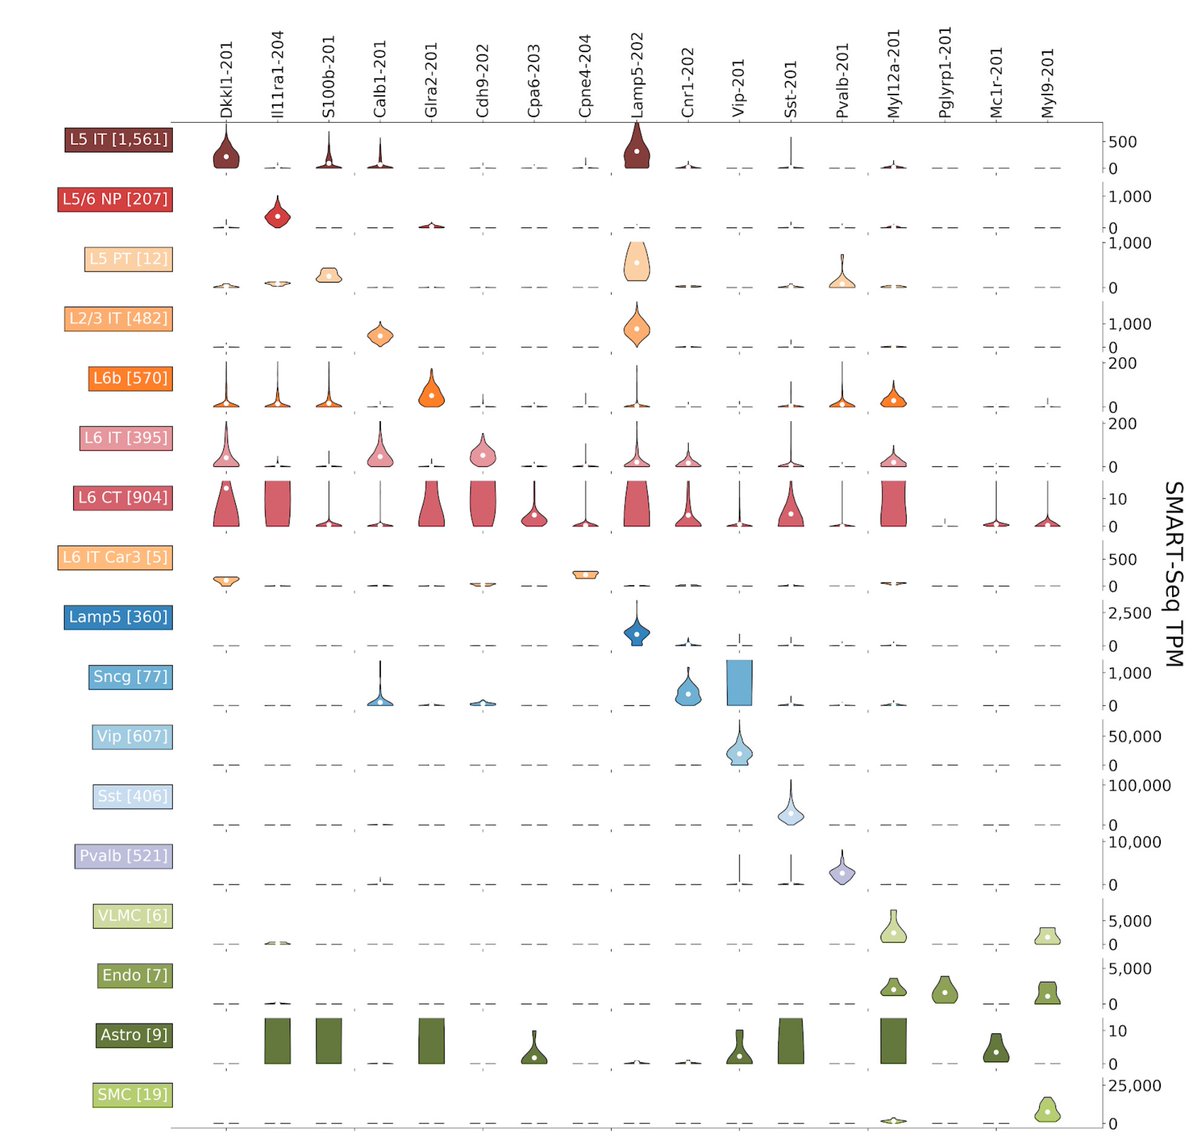
A key result is that many cell types have strong isoform markers that cannot be detected at the gene level. See the example below: 5/15
One exciting application of isoform quantification is spatial extrapolation. We show that in some cases isoform resolution can be achieved spatially even with gene probes. This is a powerful way to leverage SMART-seq for MERFISH and SEQFISH. 6/15
These results argue for a rethinking of current #scRNAseq best practices. We find that SMART-seq complements droplet-based methods and spatial RNA-seq, adding layers of important isoform resolution to cell atlases. 7/15
We recommend droplet-based high-throughput methods for cell type identification, SMART-seq for isoform resolution, and spatial RNA-seq for location information. The whole is great than the sum of the parts. 8/15
The beautiful t-SNE above is a lot cleaner than is usually the case. This is thanks to an idea of @sinabooeshaghi who made it w/ t-SNE of neighborhood component analysis (NCA) dimensionality reduction (@geoffreyhinton, Roweis et al. cs.toronto.edu/~hinton/absps/…) rather than PCA. 9/15
NCA finds a projection that maximizes a stochastic variant of the leave-one-out kNN score given cluster assignments. Intuitively, it projects so as to keep cells from the same cluster near each other, which is exactly what we want. 10/15
You might worry that NCA overfits. It doesn't. We ran a permutation test to confirm that we are seeing real structure in the data. 11/15
As an aside, we found that the t-SNE of the NCA projection preserved global structure better than t-SNE of the PCA projection (e.g., in terms of inhibitory / excitatory neuron classes). It seems that people have been confounding the performance of t-SNE (& UMAP) with PCA. 12/15
All this based on amazing publicly available data from the BICCN, and this is just a preview of the whole mouse brain which is on its way. 14/15
All of this is a result of incredible work by @sinabooeshaghi who did all the analysis single-handedly. Follow him for more interesting #scRNAseq in the near future. 15/15
• • •
Missing some Tweet in this thread? You can try to
force a refresh
So this plagiarism thing has happened to our lab.. again. This time it's plagiarism of our poseidon syringe pump paper @booeshaghi et al., 2019 in @SciReports:
Text has been plagiarized, as well as figures copied directly here: 1/🧵nature.com/articles/s4159… ijirset.com/upload/2024/ma…
Here is figure 1 from our paper (LHS) and figure 1 in the plagiarized paper (RHS) published in the "International Journal of Innovative Research" 2/ ijirset.com/upload/2024/ma…
The text seems to have been rewritten with an LLM. Our introduction (LHS) vs. the plagiarized version (RHS): 3/
I've checked this paper out, as instructed. I was also interested in the main result for personal reasons: I'm 51 years old. Is it true that I've just gone through a major change? And that another one awaits me in just a few years?
The main result about major changes in the mid 40s and 60s is shown in this plot (Fig. 4a). First, I redrew it with axes that start at 0, so the scale of change here was clearer. Not as impressive, but maybe it's a thing? 2/
The authors say that this finding is even corroborated in another study (ref 14). But that's not true. I looked it up, and it shows something totally different (see RHS Fig 3c from ref 14). No change in mid 40s, but a change in the mid 30s, and the real change in the 80s 😕 3/
I recently posted on @bound_to_love's work quantifying long-read RNA-seq. In response, a scientist acting in bad faith (Rob Patro @nomad421) trashed our work. This kind of mold in science's bathroom is extremely damaging so here's a bit of bleach. 1/🧵
At issue are benchmarking results we performed comparing our tool, lr-kallisto, to other programs including Patro's Oarfish. Shortly after we posted our preprint Patro started subtweeting our work, claiming we'd run an "appallingly wrong benchmark" and that we're "bullies". 2/
This was followed, within days, by Patro posting a hastily written preprint disguised as research work on benchmarking, but really just misusing @biorxivpreprint to broadcast the lie that our work "... may be repeatable, but it appears neither replicable nor reproducible." 3/
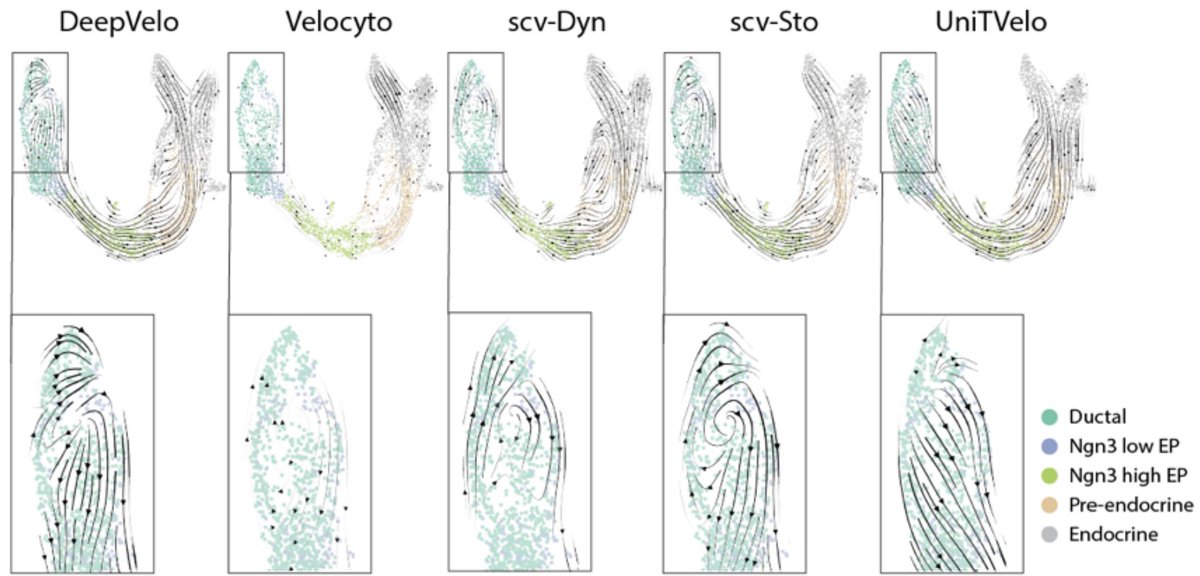
This recently published figure by @Sarah_E_Ancheta et al. is very disturbing and should lead to some deep introspection in the single-cell genomics community (I doubt it will).
It demonstrates complete disagreement among 5 widely used "RNA velocity" methods 1/
This is of course no surprise. In "RNA velocity unraveled" by @GorinGennady et al. in @PLOSCompBiol we wrote 55 page paper explaining the many ways in which RNA velocity makes no sense. 2/ journals.plos.org/ploscompbiol/a…
We're not the only ones to understand how flawed RNA velocity is. The paper from the groups of @KasperDHansen and @loyalgoff is titled "pumping the brakes on RNA velocity". The whole notion of putting arrows on UMAPs is ridiculous. 3/genomebiology.biomedcentral.com/articles/10.11…
Challenge accepted. Here are a few comments on the paper after starting to wade through its massive content. The paper in question is 1/🧵 nature.com/articles/s4158…
First, the claim that "lower OPC fraction across regions and, in particular, in non-neocortex regions was significantly associated with impaired cognition (Supplementary Fig. 37d)" is not true. Supp. Fig. 37d is below. I've boxed in red the panel the claim is based on. 2/
The R^2 value, i.e. proportion of variance explained is 0.0256. The "significance" claim is based on the reported p-value of 0.0071 which is less than 0.05. However significance vanishes once one corrects for the number of tests performed. 3/