Pakistan's Economic Crises 2018
Economic crises are not earthquakes which strike without warning; they are culmination of years of excesses & misguided macroeconomic policies
CAD reached $19.9bn in FY18 which was the highest ever in the country’s history in absolute terms
1/N
Economic crises are not earthquakes which strike without warning; they are culmination of years of excesses & misguided macroeconomic policies
CAD reached $19.9bn in FY18 which was the highest ever in the country’s history in absolute terms
1/N
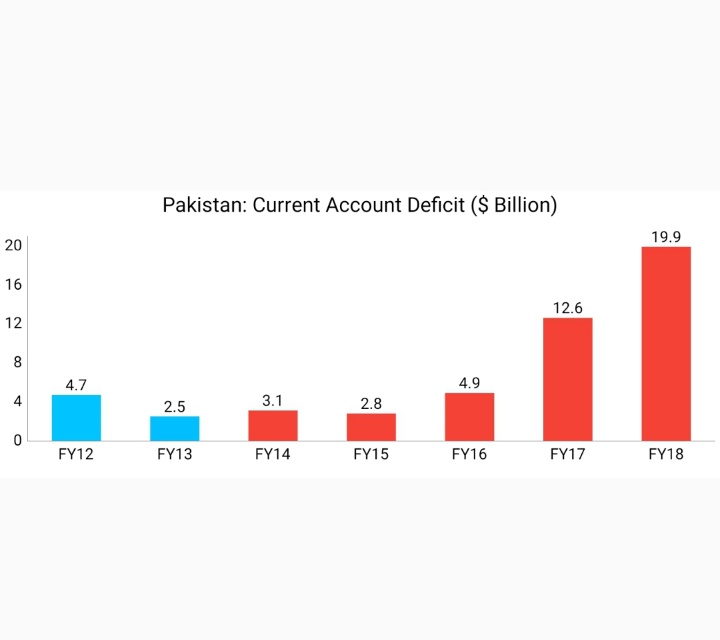
Current Account Deficit (CAD) surged from 1.1% of GDP in FY13 to 6.3% of GDP in FY18
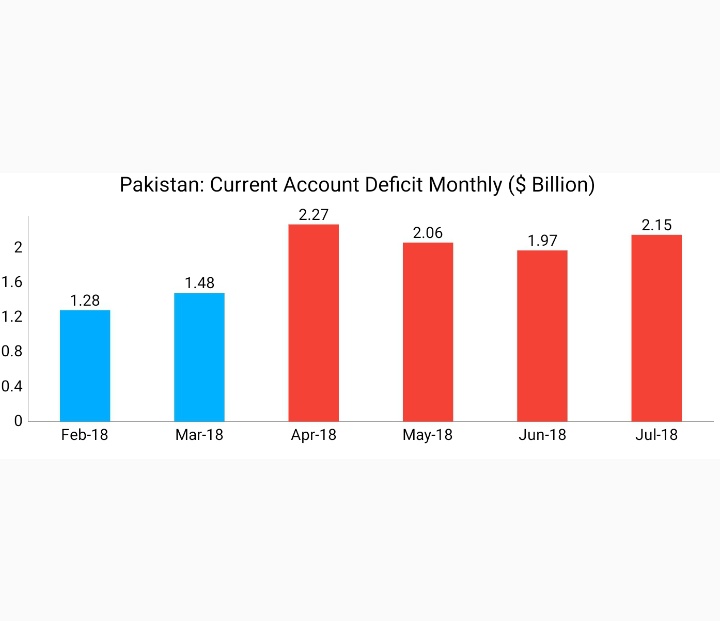
Last 4 months before the new govt coming into power we were running a CAD of $2bn a month this means at an annualised pace of $24bn
Source:
sbp.org.pk/ecodata/BOP-Se…
sbp.org.pk/ecodata/BOP_ar…
2/N
Last 4 months before the new govt coming into power we were running a CAD of $2bn a month this means at an annualised pace of $24bn
Source:
sbp.org.pk/ecodata/BOP-Se…
sbp.org.pk/ecodata/BOP_ar…
2/N
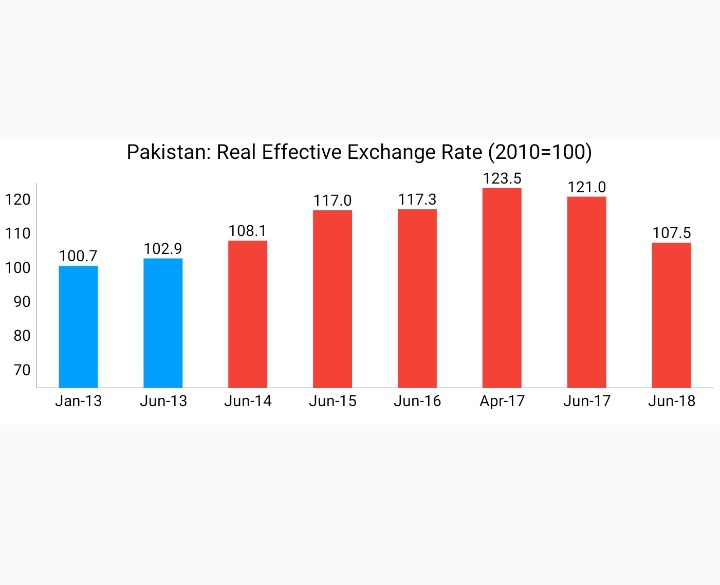
An increase in REER implies that exports become more expensive & imports become cheaper; therefore, an increase indicates a loss in trade competitiveness
REER value of 100 reflects fair valuation
REER had appreciated to 123.5 by April-17
Source:sbp.org.pk/departments/st…
3/N
REER value of 100 reflects fair valuation
REER had appreciated to 123.5 by April-17
Source:sbp.org.pk/departments/st…
3/N
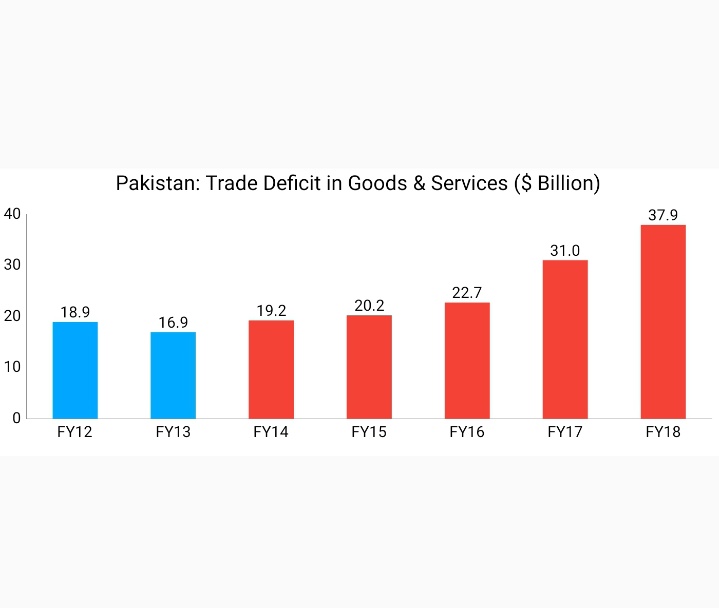
Misaligned exchange rate subsidized imports, leading to huge surge in the trade deficit
Trade Deficit more than doubled to $37.9bn by FY18, from $16.9bn in FY13
Real effective exchange rate (REER)
Free on board (FOB)
Source:
sbp.org.pk/ecodata/Export…
finance.gov.pk/survey/chapter…
4/N
Trade Deficit more than doubled to $37.9bn by FY18, from $16.9bn in FY13
Real effective exchange rate (REER)
Free on board (FOB)
Source:
sbp.org.pk/ecodata/Export…
finance.gov.pk/survey/chapter…
4/N
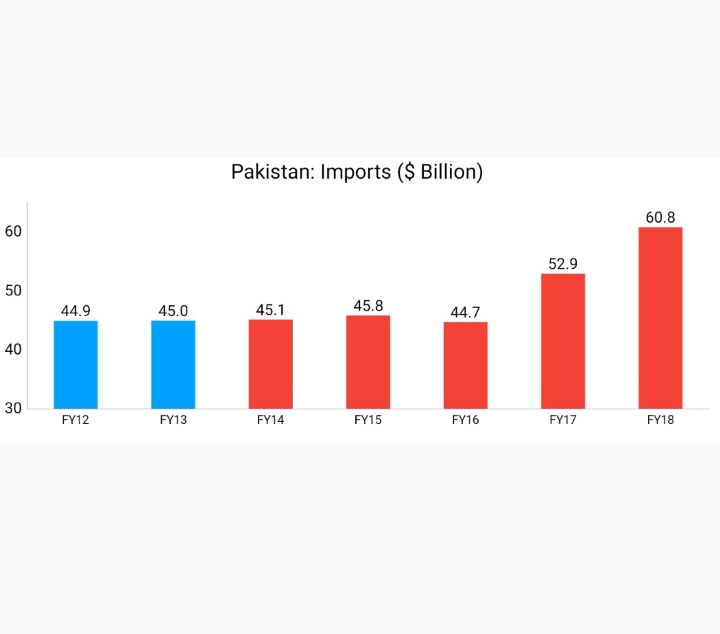
Imports increased from $45bn in FY13 to $60.8bn in FY18
Imports (FOB) increased from 17.4% of GDP in FY13 to 18% of GDP in FY18
Source:
pbs.gov.pk/sites/default/…
finance.gov.pk/survey/chapter…
5/N
Imports (FOB) increased from 17.4% of GDP in FY13 to 18% of GDP in FY18
Source:
pbs.gov.pk/sites/default/…
finance.gov.pk/survey/chapter…
5/N
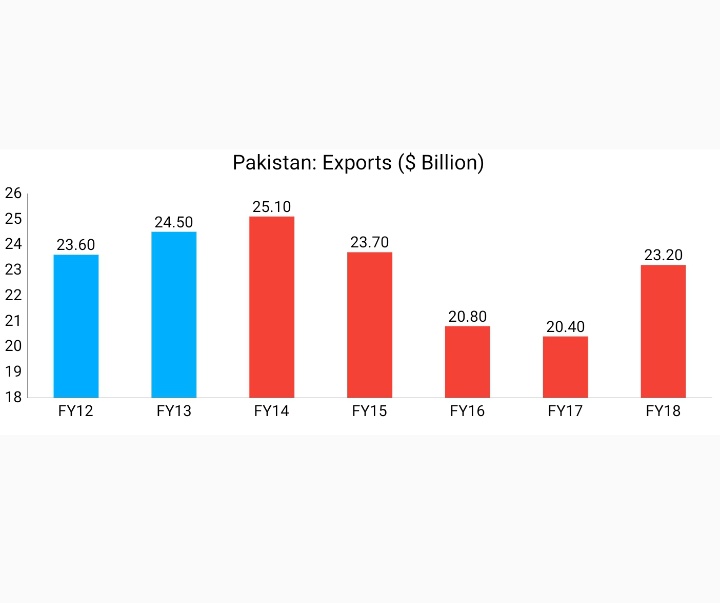
Pakistan's exports fell from $24.5bn in FY13 to $23.2bn in FY18
Exports (FOB) fell from 10.7% of GDP in FY13 to 7.9% of GDP in FY18
State Bank of Pakistan (SBP)
Public Sector Enterprises (PSEs)
Source:
pbs.gov.pk/sites/default/…
finance.gov.pk/survey/chapter…
6/N
Exports (FOB) fell from 10.7% of GDP in FY13 to 7.9% of GDP in FY18
State Bank of Pakistan (SBP)
Public Sector Enterprises (PSEs)
Source:
pbs.gov.pk/sites/default/…
finance.gov.pk/survey/chapter…
6/N
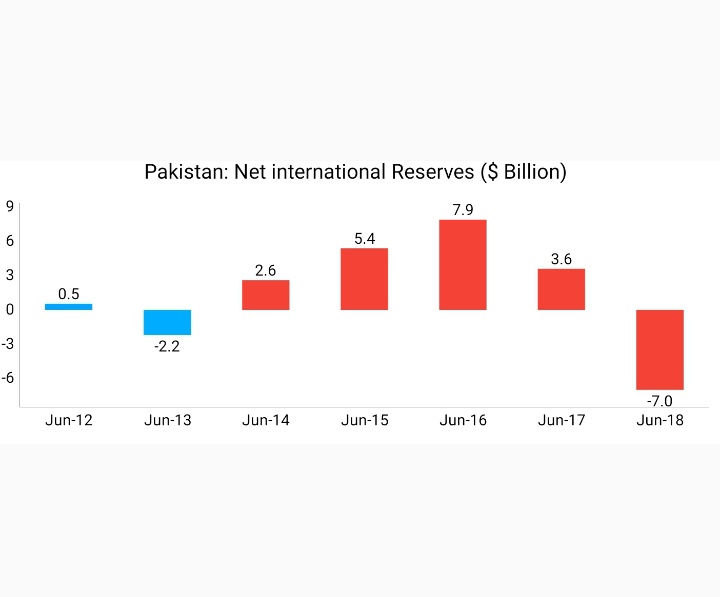
Net International Reserve (NIR) is about the amount SBP has to finance CAD by its own – in short it depicts, how much import led growth a country can afford
NIR is the amount which gives a country leverage to run pro-growth policies where import increase can be absorbed
7/N
NIR is the amount which gives a country leverage to run pro-growth policies where import increase can be absorbed
7/N
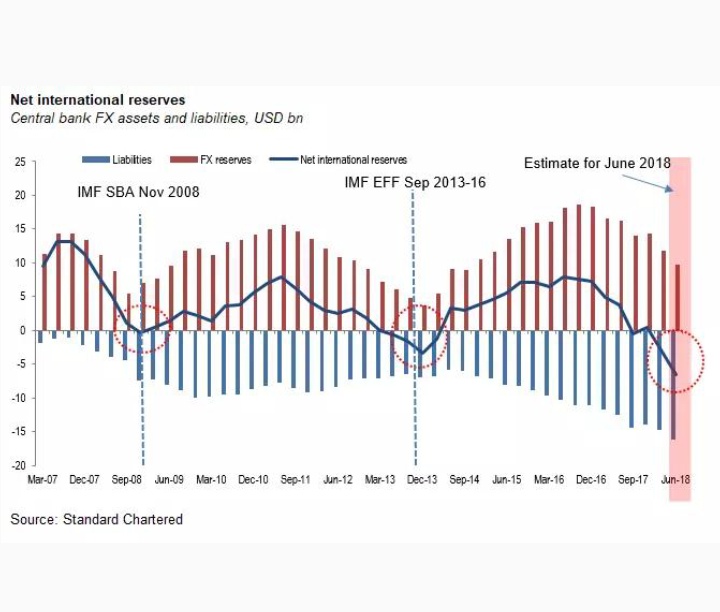
When the NIR runs in negative, any external shock can create massive crisis – crippling the economy by free fall in currency which can be followed by hyper-inflation
NIR fell from -$2.2bn in FY13 to -$7bn in FY18
Source:
sbp.org.pk/ecodata/Liquid…
sbp.org.pk/ecodata/Forex_…
8/N
NIR fell from -$2.2bn in FY13 to -$7bn in FY18
Source:
sbp.org.pk/ecodata/Liquid…
sbp.org.pk/ecodata/Forex_…
8/N
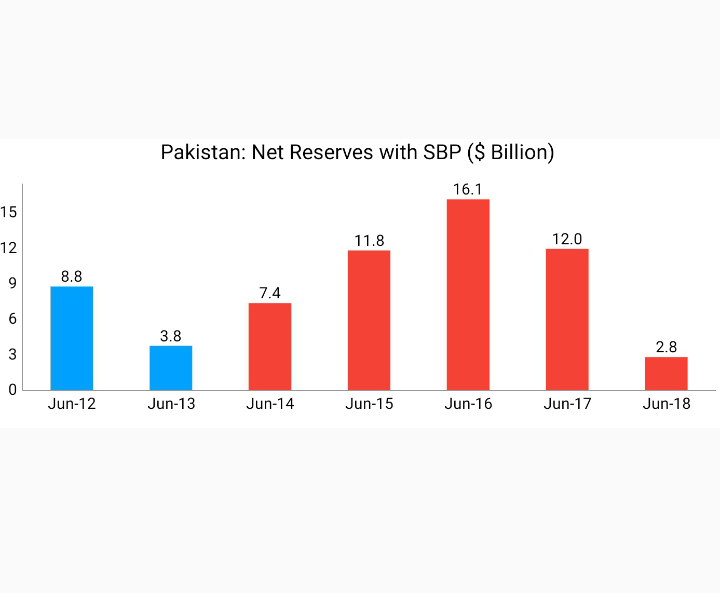
Net Reserves with SBP are calculated by subtracting forward/Swaps from SBP's Gross Reserves
With CAD averaging $2bn a month & SBP's Net Reserves falling to $2.8bn this indicated risks of a sovereign default
Source:
sbp.org.pk/ecodata/Forex_…
sbp.org.pk/ecodata/pakdeb…
9/N
With CAD averaging $2bn a month & SBP's Net Reserves falling to $2.8bn this indicated risks of a sovereign default
Source:
sbp.org.pk/ecodata/Forex_…
sbp.org.pk/ecodata/pakdeb…
9/N
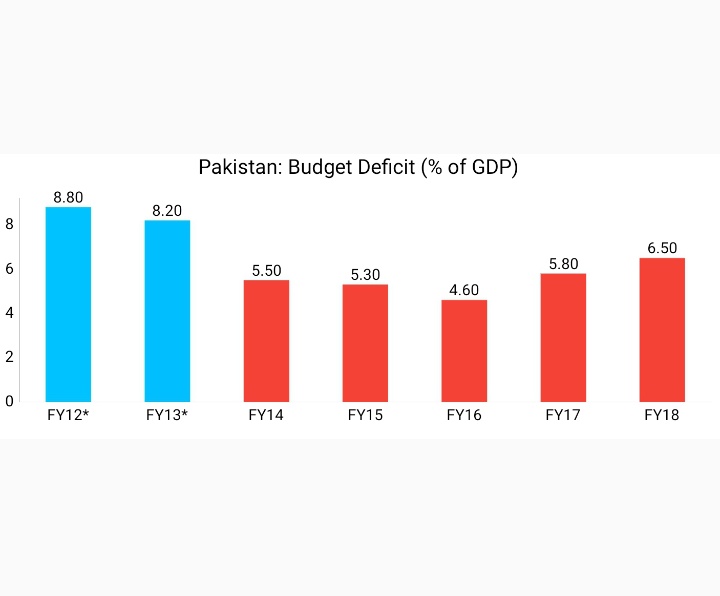
Fiscal deficit soared to 6.5% in FY18
Financial losses of PSEs were at a record high level of 1.4%
of GDP, implying overall fiscal & quasi fiscal deficit of about 8% of GDP & Energy sector circular debt of Rs1.2tr
Source:
finance.gov.pk/publications/F…
finance.gov.pk/A_Roadmap_for_…
10/N
Financial losses of PSEs were at a record high level of 1.4%
of GDP, implying overall fiscal & quasi fiscal deficit of about 8% of GDP & Energy sector circular debt of Rs1.2tr
Source:
finance.gov.pk/publications/F…
finance.gov.pk/A_Roadmap_for_…
10/N
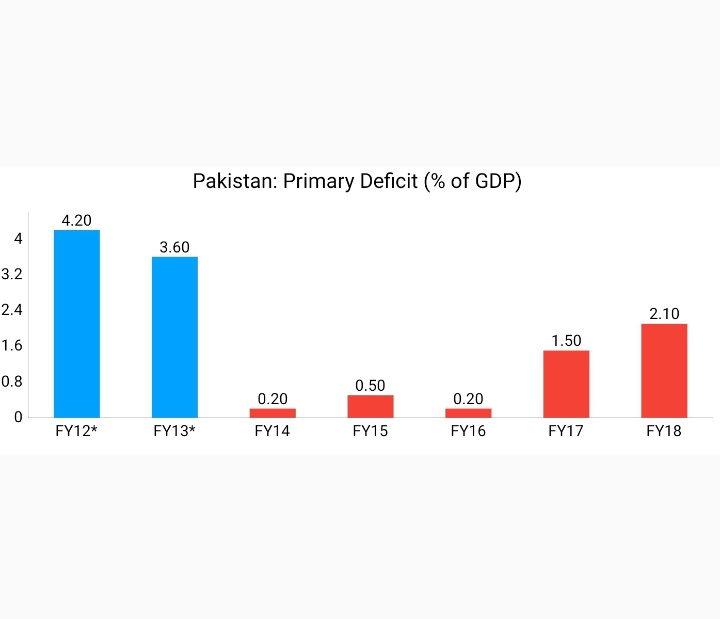
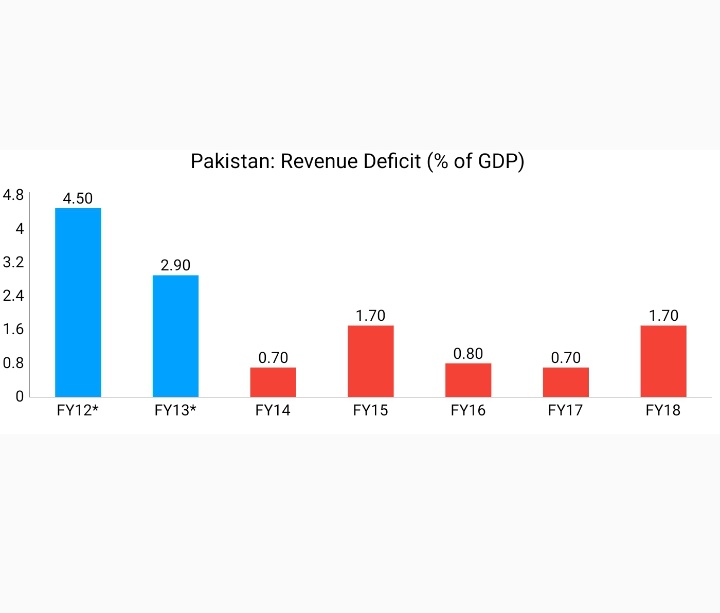
Primary balance is the total revenues minus non-interest exp
Primary deficit means that govt is borrowing monies to pay interest
payment on the debt stock, debt trap
FY12* include payment of debt consolidation 2% of GDP
FY13* include resolution of Circular Debt 1.4% of GDP
11/N
Primary deficit means that govt is borrowing monies to pay interest
payment on the debt stock, debt trap
FY12* include payment of debt consolidation 2% of GDP
FY13* include resolution of Circular Debt 1.4% of GDP
11/N
Revenue balance is the total revenues minus current exp
The persistence of revenue deficit indicates that the govt is not only borrowing to finance its development exp, but partially also financing its current exp
Source:
finance.gov.pk/publications/D…
finance.gov.pk/publications/D…
12/N
The persistence of revenue deficit indicates that the govt is not only borrowing to finance its development exp, but partially also financing its current exp
Source:
finance.gov.pk/publications/D…
finance.gov.pk/publications/D…
12/N
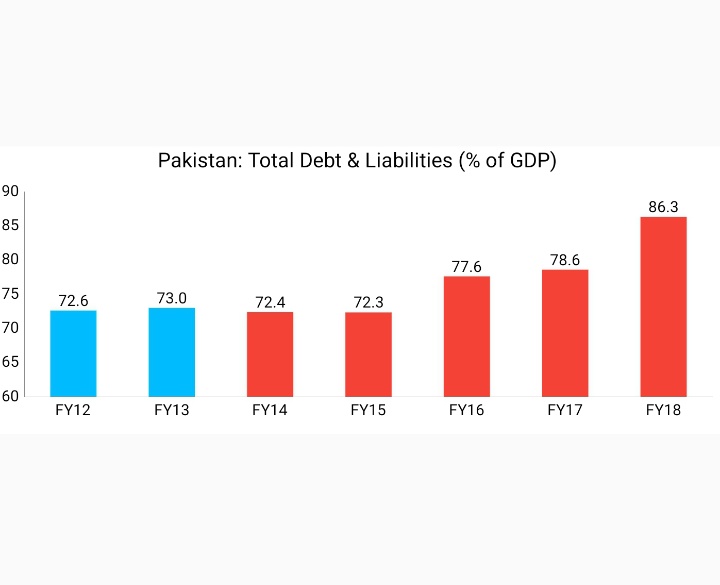
Total Debt & Liabilities (TDL) surged from 73% of GDP in FY13 to 86.3% of GDP in FY18
In absolute terms, it surged from Rs16,338bn in FY13 to Rs29,879bn in FY18 - up 83%
TDL includes Govt, Private sector, PSEs Debt & commodity operations etc
Source:sbp.org.pk/ecodata/Summar…
13/N
In absolute terms, it surged from Rs16,338bn in FY13 to Rs29,879bn in FY18 - up 83%
TDL includes Govt, Private sector, PSEs Debt & commodity operations etc
Source:sbp.org.pk/ecodata/Summar…
13/N
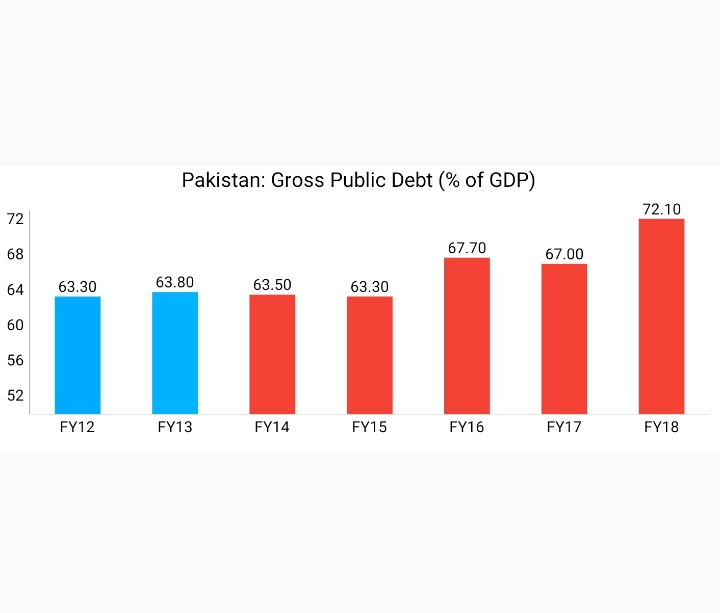
Gross Public Debt increased from 63.8% of GDP in FY13 to 72.1% of GDP in FY18
In absolute terms, it increased from Rs14,292bn in FY13 to Rs24,953bn in FY18 - an increase of 75%
Source:sbp.org.pk/ecodata/Summar…
14/N
In absolute terms, it increased from Rs14,292bn in FY13 to Rs24,953bn in FY18 - an increase of 75%
Source:sbp.org.pk/ecodata/Summar…
14/N
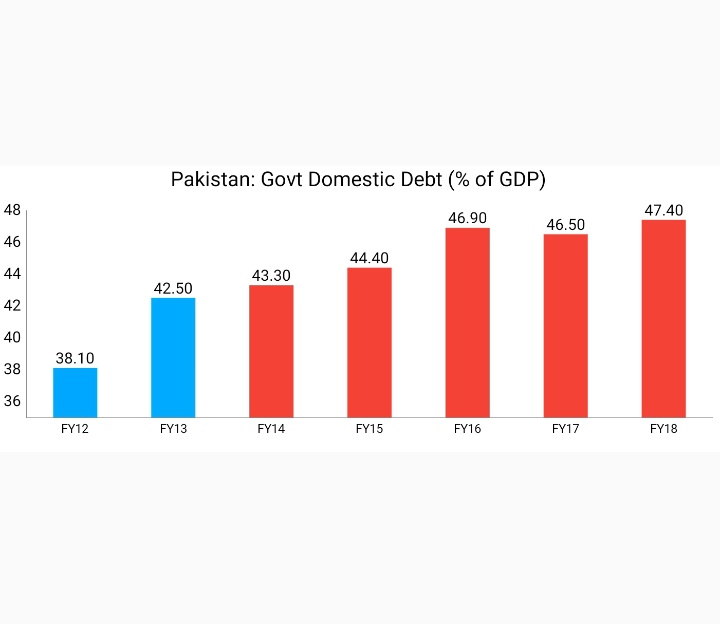
Govt Domestic Debt increased from 42.5% of GDP in FY13 to 47.4% of GDP in FY18
In absolute terms, It increased from Rs9,520bn in FY13 to Rs16,416bn in FY18 - an increase of 72%
Source:sbp.org.pk/ecodata/Summar…
15/N
In absolute terms, It increased from Rs9,520bn in FY13 to Rs16,416bn in FY18 - an increase of 72%
Source:sbp.org.pk/ecodata/Summar…
15/N
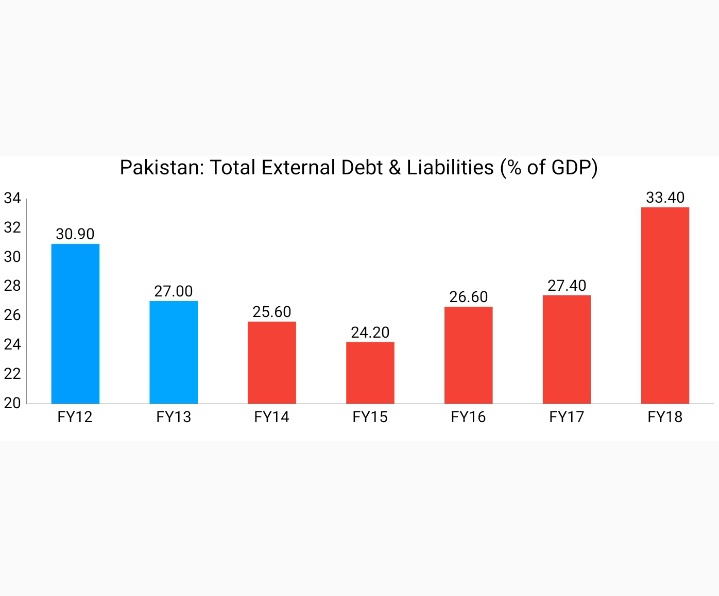
Total External Debt & Liabilities increased from 27% of GDP in FY13 to 33.4% of GDP in FY18
In absolute terms, It increased from $60,899 million in FY13 to $95,237 million in FY18 - an increase of 56.4%
Source:sbp.org.pk/ecodata/pakdeb…
16/N
In absolute terms, It increased from $60,899 million in FY13 to $95,237 million in FY18 - an increase of 56.4%
Source:sbp.org.pk/ecodata/pakdeb…
16/N
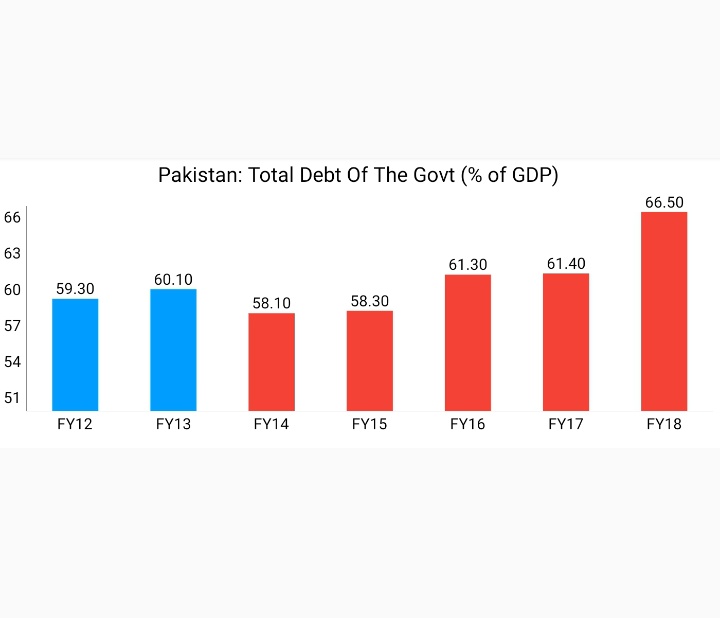
Total Debt of the Govt increased from 60.1% of GDP in FY13 to 66.5% of GDP in FY18
In absolute terms, It increased from Rs13,457bn in FY13 to Rs23,024bn in FY18 - an increase of 71%
Source:sbp.org.pk/ecodata/Summar…
17/N
In absolute terms, It increased from Rs13,457bn in FY13 to Rs23,024bn in FY18 - an increase of 71%
Source:sbp.org.pk/ecodata/Summar…
17/N
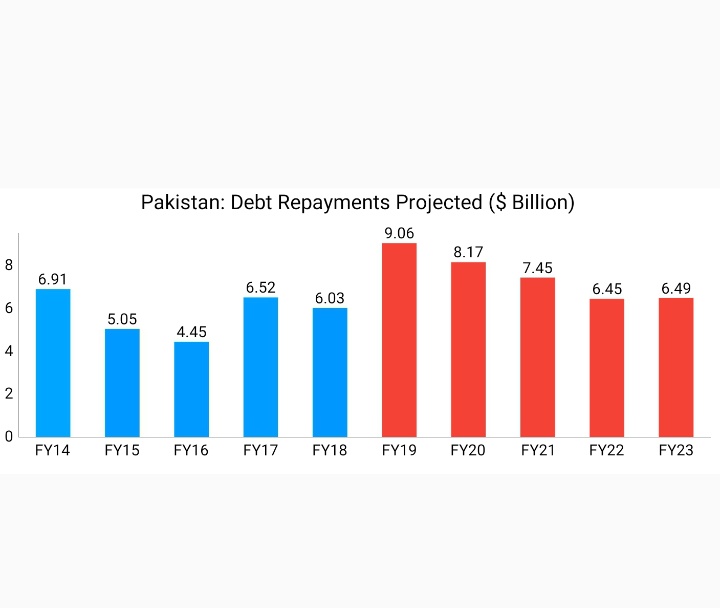
Total Debt Repayment obligations for the incoming govt cumulatively stood at $37.6bn in 5 years without borrowing a single penny
In Blue bars are the actual Debt Repayments
In Red bars are the debt Repayments due
Source:
nation.com.pk/06-Jan-2019/go…
finance.gov.pk/publications/D…
18/N
In Blue bars are the actual Debt Repayments
In Red bars are the debt Repayments due
Source:
nation.com.pk/06-Jan-2019/go…
finance.gov.pk/publications/D…
18/N
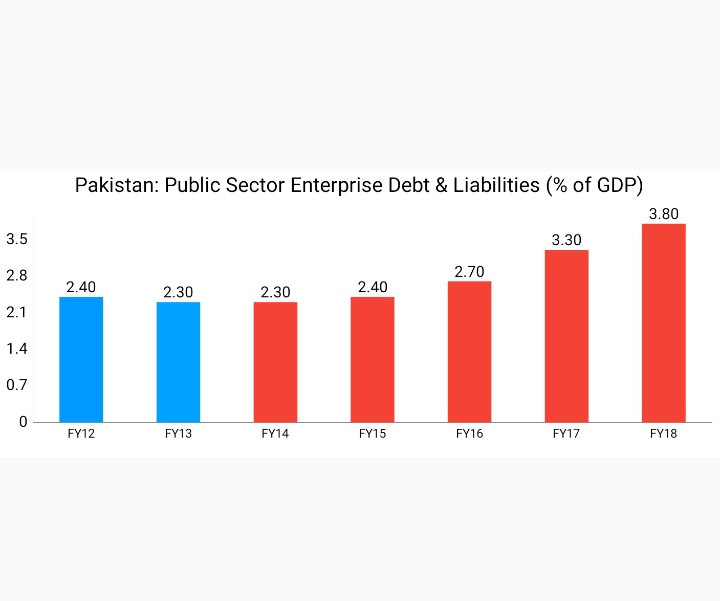
PSEs Debt & Liabilities surged from 2.3% of GDP in FY13 to 3.8% of GDP in FY18
In absolute terms, it surged from Rs538.1bn in FY13 to Rs1,299.5bn in FY18 - an increase of 141.5%
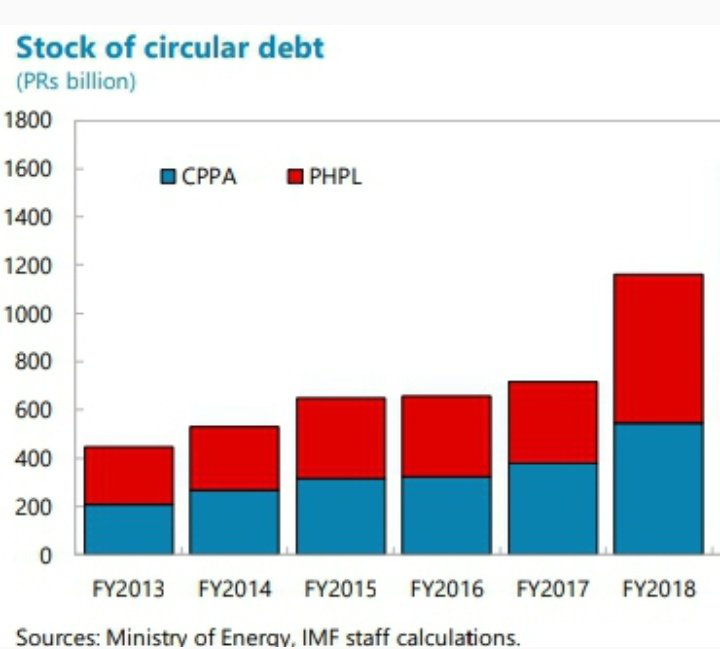
Central Power Purchasing Agency (CPPA)
Source:
sbp.org.pk/reports/stat_r…
sbp.org.pk/reports/stat_r…
19/N
In absolute terms, it surged from Rs538.1bn in FY13 to Rs1,299.5bn in FY18 - an increase of 141.5%
Central Power Purchasing Agency (CPPA)
Source:
sbp.org.pk/reports/stat_r…
sbp.org.pk/reports/stat_r…
19/N
Circular debt surged from Rs503bn at end may'13 to Rs1,196bn in FY18 - an increase of 137.8%
It is the amount of cash shortfall within the CPPA which it cannot pay to power supply companies
Source:
senate.gov.pk/uploads/docume…
senate.gov.pk/uploads/docume…
imf.org/~/media/Files/…
20/N
It is the amount of cash shortfall within the CPPA which it cannot pay to power supply companies
Source:
senate.gov.pk/uploads/docume…
senate.gov.pk/uploads/docume…
imf.org/~/media/Files/…
20/N
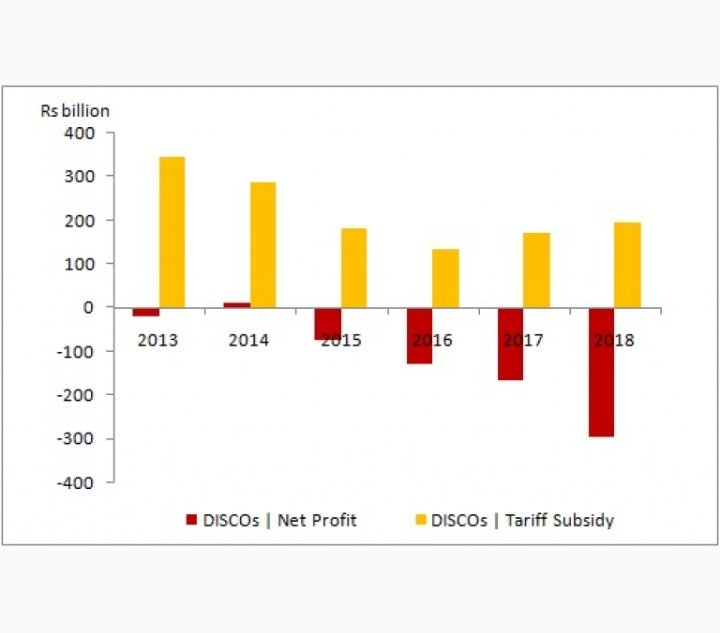
In Jun'13, Accumulated losses of 10 discos were a mere Rs20bn, & the year previous govt left the toll surged to Rs296bn. The Accumulated losses of DISCOs in previous govt's last 4 years stood at Rs662bn. This is how circular debt builds
Source:brecorder.com/2019/05/06/494…
21/N
Source:brecorder.com/2019/05/06/494…
21/N
Circular debt refers to cash flow shortfall incurred in power sector from non-payment of obligations by consumers, distribution companies, & govt
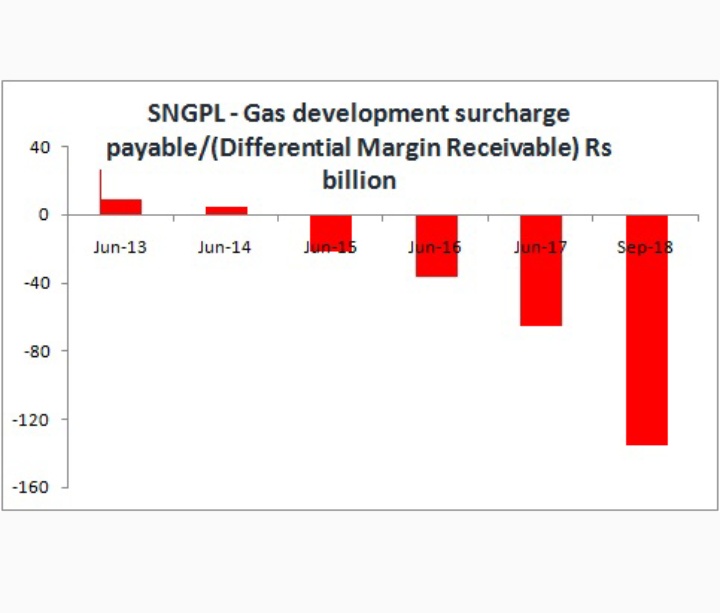
Differential margin is created by disparity between prescribed gas prices by OGRA & notified consumer tariff(includes subsidies)
22/N
Differential margin is created by disparity between prescribed gas prices by OGRA & notified consumer tariff(includes subsidies)
22/N
In Jun'13, The gas development surcharge payable to govt was Rs26bn which turned into differential margin- receivable from govt in FY15 & it stood at Rs122bn by the end of FY18
This explains why gas prices increased
Source:
brecorder.com/2019/05/06/494…
brecorder.com/2019/05/09/495…
23/N
This explains why gas prices increased
Source:
brecorder.com/2019/05/06/494…
brecorder.com/2019/05/09/495…
23/N
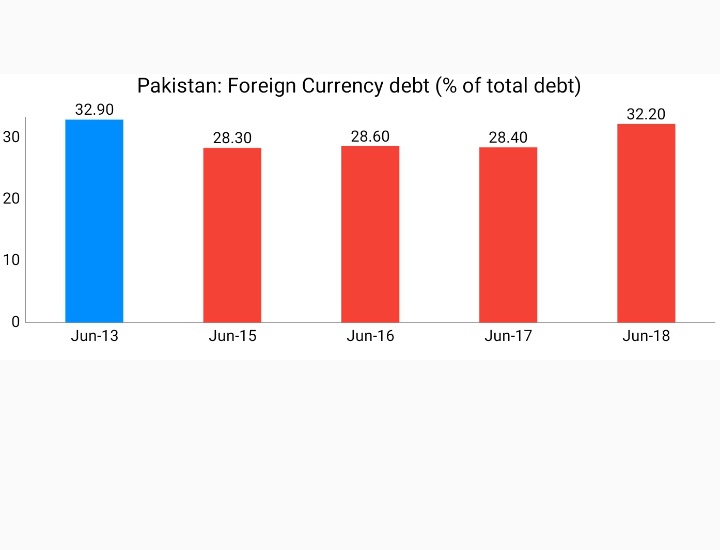
The Foreign Currency debt (% of total debt) increased from 28.4% in Jun'17 to 32.2% by Jun'18
Source:
finance.gov.pk/dpco/RiskRepor…
finance.gov.pk/Quarterly_Risk…
24/N
Source:
finance.gov.pk/dpco/RiskRepor…
finance.gov.pk/Quarterly_Risk…
24/N
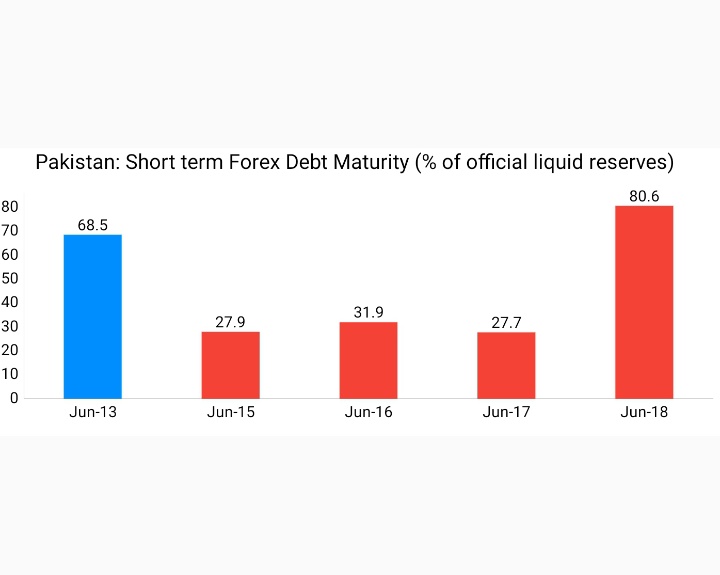
Pakistan’s short & long-term debt (maturing in the one year) increased to 80.6% of the total liquid foreign currency reserves by Jun'18. This ratio was only 27.7% in Jun'17, indicating the danger of a default
Source:
finance.gov.pk/Quarterly_Risk…
finance.gov.pk/RiskReportOnDe…
25/N
Source:
finance.gov.pk/Quarterly_Risk…
finance.gov.pk/RiskReportOnDe…
25/N
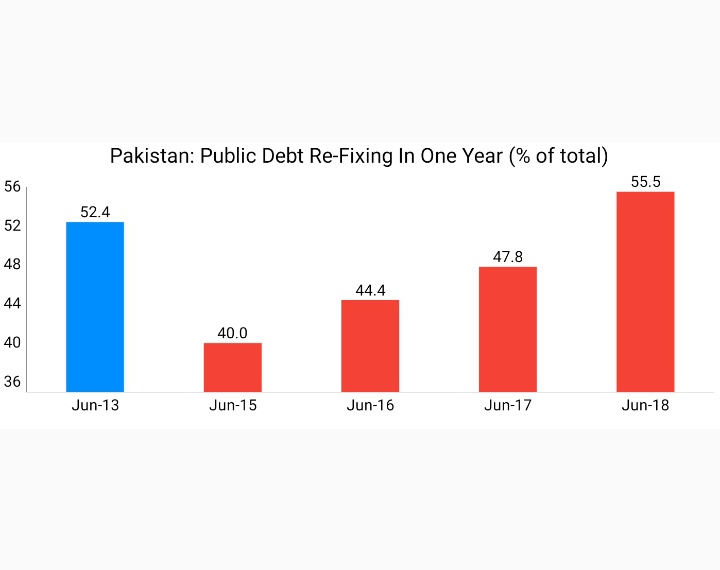
Public Debt that has to be re-fixed in one year increased from 47.8% in Jun'17 to 55.5% in Jun'18
Source:
finance.gov.pk/dpco/RiskRepor…
26/N
Source:
finance.gov.pk/dpco/RiskRepor…
26/N
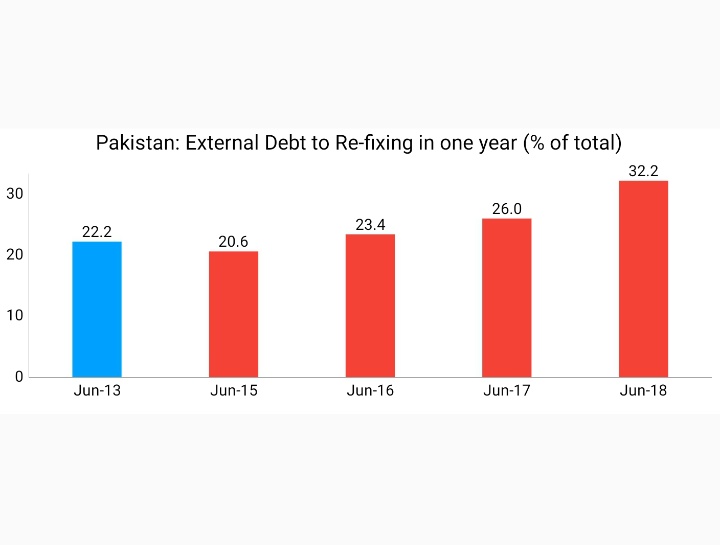
The external debt that requires to be readjusted in one year to new interest rates increased from 22.2% in Jun'13 to 32.2% in Jun'18
Source:
finance.gov.pk/dpco/RiskRepor…
27/N
Source:
finance.gov.pk/dpco/RiskRepor…
27/N
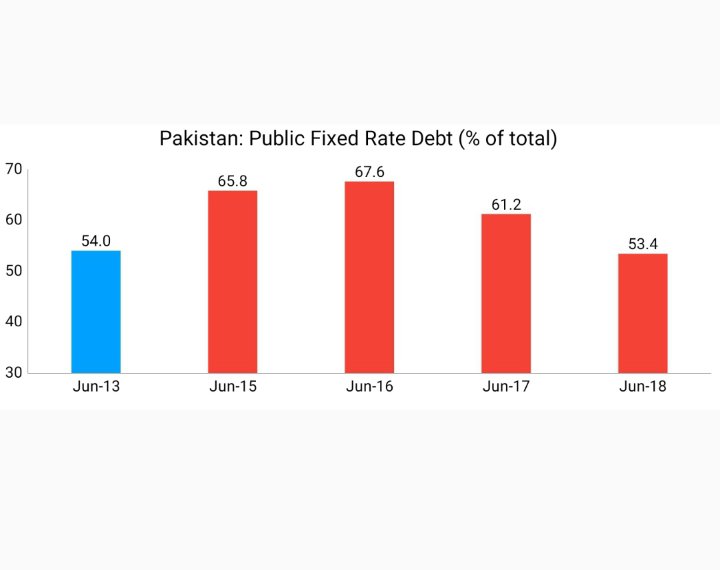
The ratio of fixed rate public debt came down from 61.2% in Jun'17 to 53.4% by Jun'18
Source:
finance.gov.pk/dpco/RiskRepor…
tribune.com.pk/story/1821958/…
28/N
Source:
finance.gov.pk/dpco/RiskRepor…
tribune.com.pk/story/1821958/…
28/N
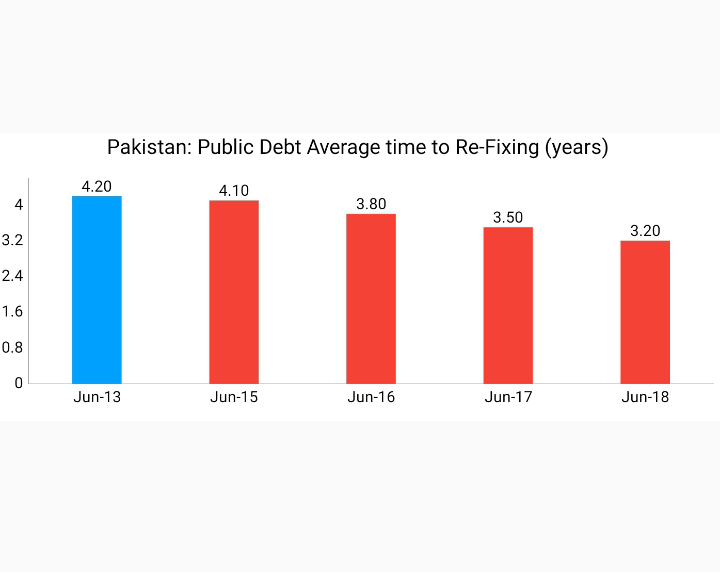
Average time to re-fixing is a measure of weighted average time until all principal payments in the debt portfolio become subject to a new interest rate
Average time to Re-Fixing of Public Debt fell from 4.2 yrs in Jun'13 to 3.2 yrs in Jun18
Source:
finance.gov.pk/dpco/RiskRepor…
29/N
Average time to Re-Fixing of Public Debt fell from 4.2 yrs in Jun'13 to 3.2 yrs in Jun18
Source:
finance.gov.pk/dpco/RiskRepor…
29/N
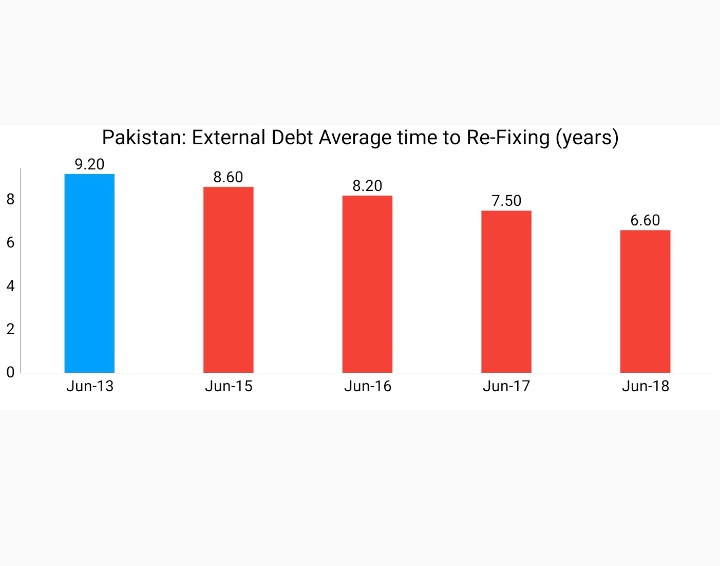
External Debt Average time to Re-Fixing fell from 9.2 years in Jun'13 to 6.6 years in Jun'18
Source:
finance.gov.pk/dpco/RiskRepor…
30/N
Source:
finance.gov.pk/dpco/RiskRepor…
30/N
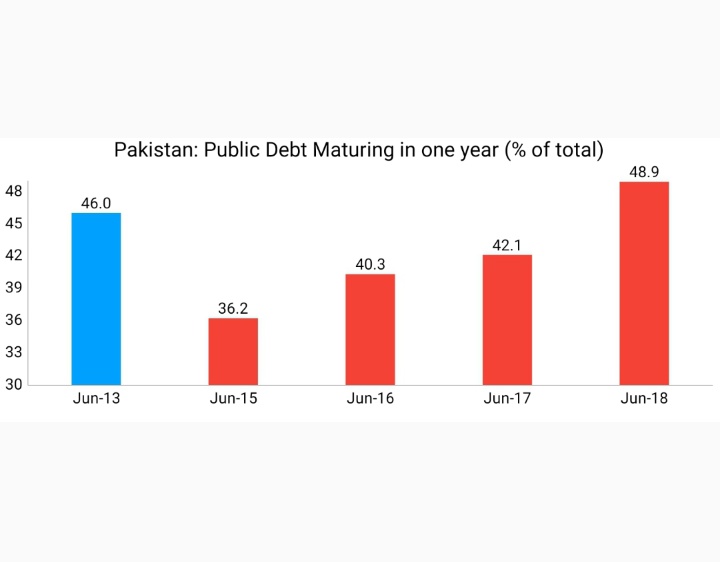
Public Debt Maturing in one year (% of total) surged from 36.2% in Jun'15 to 48.9% in Jun'18
Source:
finance.gov.pk/dpco/RiskRepor…
31/N
Source:
finance.gov.pk/dpco/RiskRepor…
31/N
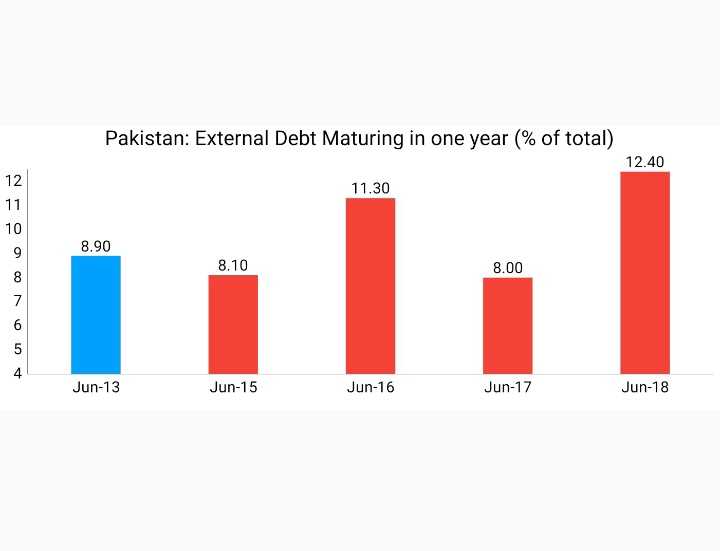
External Debt Maturing in one year (% of total) surged from 8.9% in Jun'13 to 12.4% in Jun'18
Source:
finance.gov.pk/dpco/RiskRepor…
32/N
Source:
finance.gov.pk/dpco/RiskRepor…
32/N
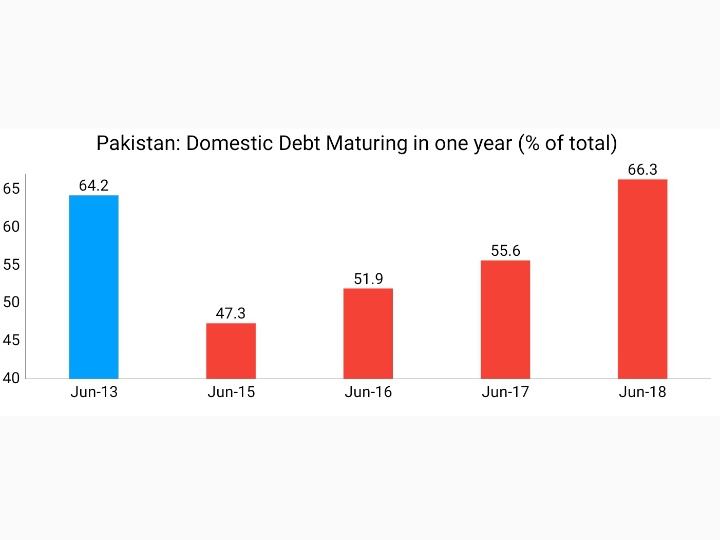
Domestic Debt Maturing in one year (% of total) surged from 47.3% in Jun'15 to 66.3% in Jun'18
Source:
finance.gov.pk/dpco/RiskRepor…
33/N
Source:
finance.gov.pk/dpco/RiskRepor…
33/N
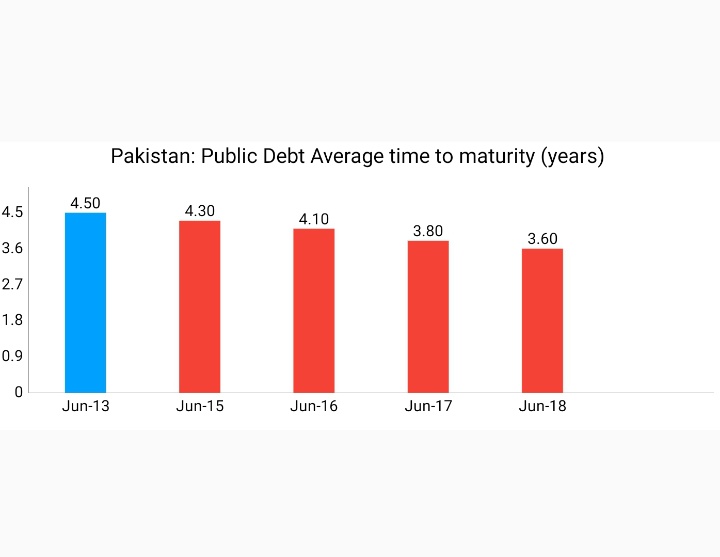
Public Debt Average time to maturity fell from 4.5 years to 3.6 years
Source:
finance.gov.pk/dpco/RiskRepor…
34/N
Source:
finance.gov.pk/dpco/RiskRepor…
34/N
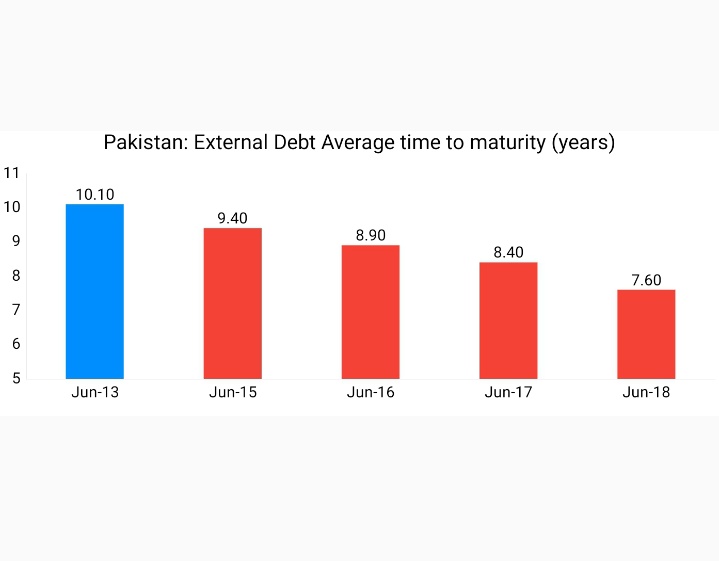
The average time-to-maturity of external debt decreased from 10.1 years in FY13 to 7.6 years in FY18
Source:
finance.gov.pk/dpco/RiskRepor…
35/N
Source:
finance.gov.pk/dpco/RiskRepor…
35/N
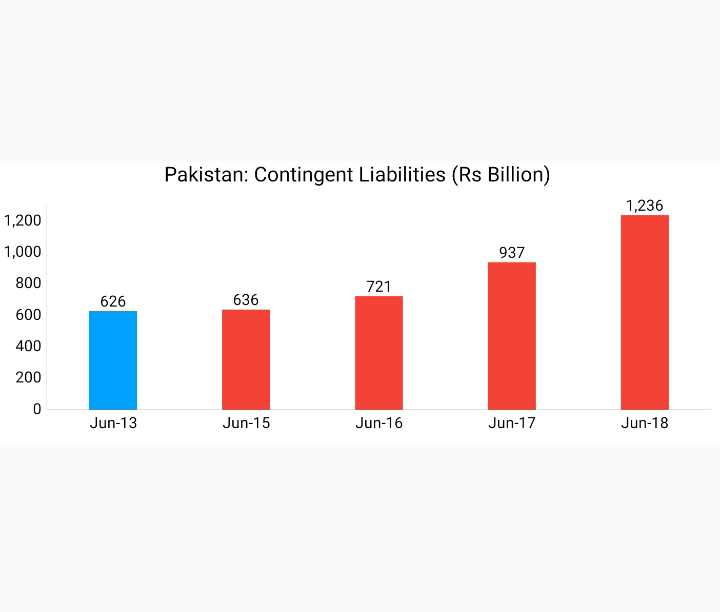
Contingent liabilities (CLs) are off-budget activities that appear on govt balance sheet only
when event actually happens
It relates to govt guarantees on behalf of PSEs
CLs surged from Rs625.9bn in Jun'13 to Rs1236.2 in Jun'18 - up 97.5%
Source:
finance.gov.pk/dpco/RiskRepor…
36/N
when event actually happens
It relates to govt guarantees on behalf of PSEs
CLs surged from Rs625.9bn in Jun'13 to Rs1236.2 in Jun'18 - up 97.5%
Source:
finance.gov.pk/dpco/RiskRepor…
36/N
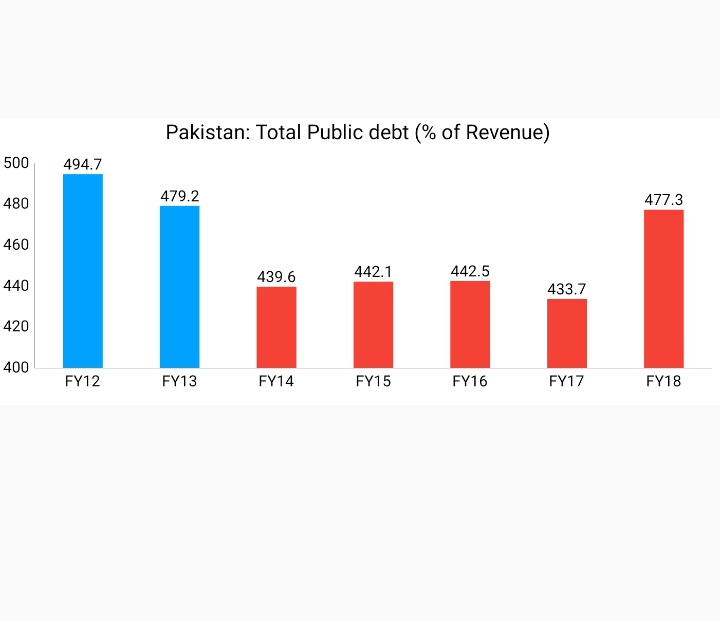
Total Public debt (% of Revenue) increased from 439.6% in FY14 to 477.3% in FY18
Source:
finance.gov.pk/publications/D…
finance.gov.pk/publications/D…
37/N
Source:
finance.gov.pk/publications/D…
finance.gov.pk/publications/D…
37/N
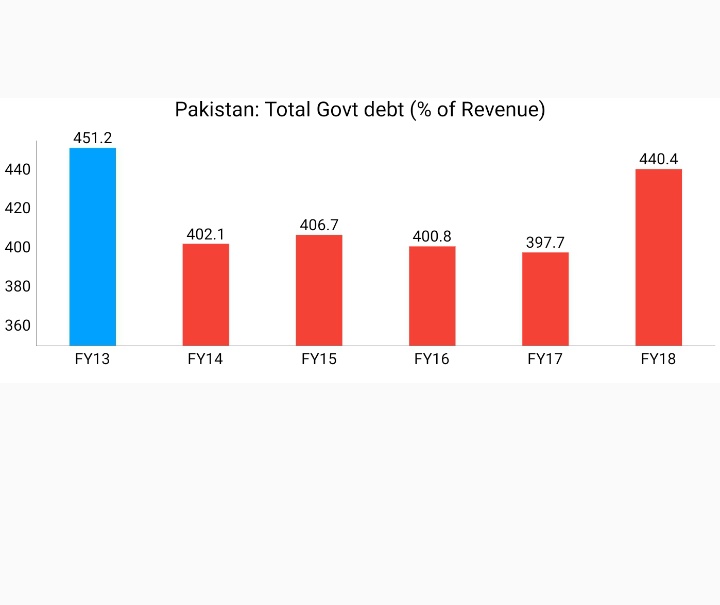
Total Govt debt (% of Revenue) increased from 402.1% in FY14 to 440.4% in FY18
Source:
finance.gov.pk/publications/D…
38/N
Source:
finance.gov.pk/publications/D…
38/N
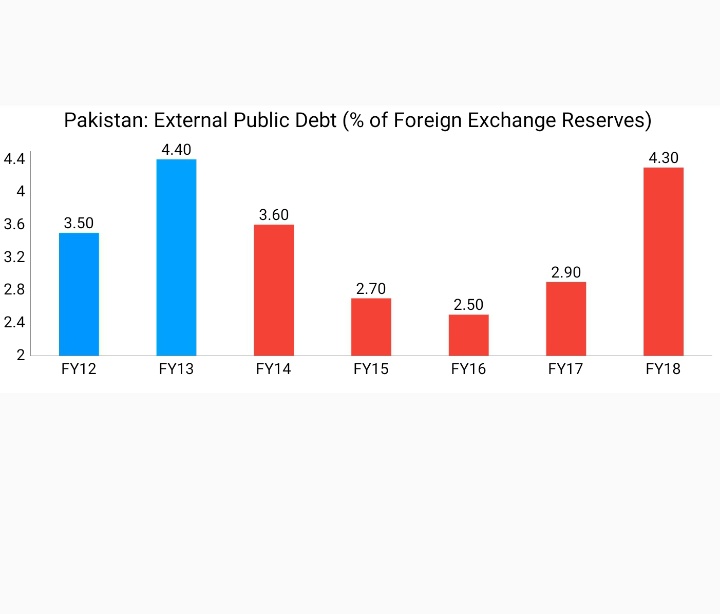
External Public Debt (% of Foreign Exchange Reserves) increased from 3.6% in FY14 to 4.3% in FY18
Source:
finance.gov.pk/publications/D…
finance.gov.pk/publications/D…
39/N
Source:
finance.gov.pk/publications/D…
finance.gov.pk/publications/D…
39/N
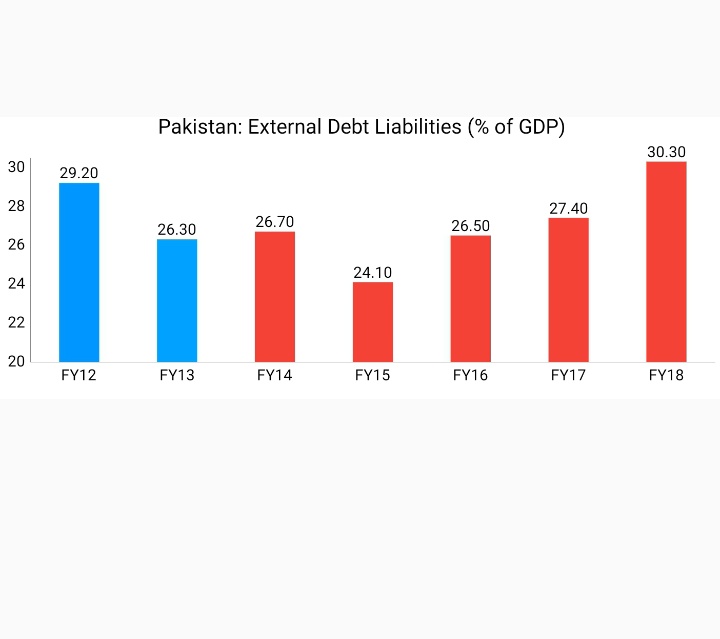
External Debt Liabilities (% of GDP) increased from 26.3% in FY13 to 30.3% in FY18
Source:
finance.gov.pk/publications/D…
finance.gov.pk/publications/D…
40/N
Source:
finance.gov.pk/publications/D…
finance.gov.pk/publications/D…
40/N
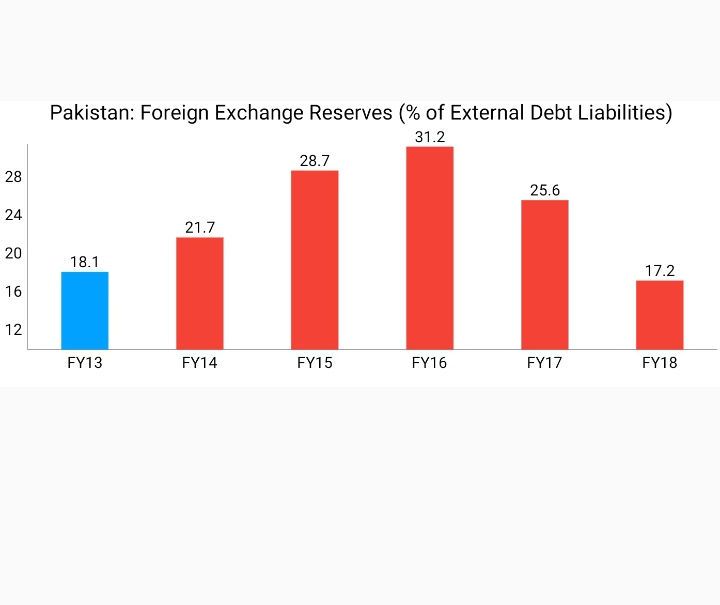
Foreign Exchange Reserves (% of External Debt Liabilities) decreased from 18.1% in FY13 to 17.2% in FY18
Source:
finance.gov.pk/publications/D…
41/N
Source:
finance.gov.pk/publications/D…
41/N
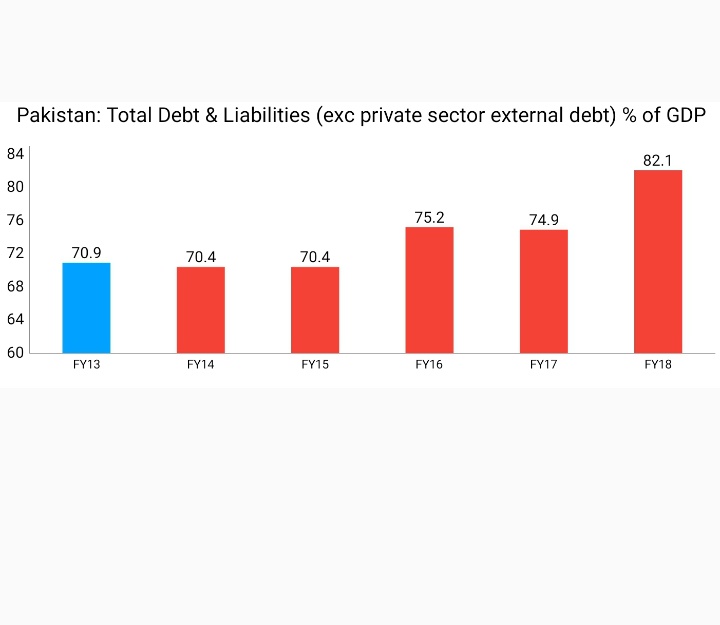
Total Debt & Liabilities (excluding private sector external debt) as % of GDP increased from 70.9% in FY13 to 82.1% in FY18
In absolute terms, it increased from Rs15,873bn in FY13 to Rs28,253 in FY18 - an increase of 78%
Source:
finance.gov.pk/publications/D…
42/N
In absolute terms, it increased from Rs15,873bn in FY13 to Rs28,253 in FY18 - an increase of 78%
Source:
finance.gov.pk/publications/D…
42/N