A student of Economics, interested in Business, Finance and Macroeconomic policy making
How to get URL link on X (Twitter) App


 There are two cost components to Generation tariff: i) energy purchase price (EPP) ii) capacity purchase price (CPP). EPP includes fuel costs whereas CPP includes debt recovery for setting up plants

https://x.com/samigodil/status/1398304992302301186?s=19


 The cost of petrol (base price) increased by Rs9.78. So, the govt actually reduced the taxes by Rs4.40 to not pass on the full increase

 Fiscal Deficit is at Rs1,652.05 billion (-3.6% of GDP) in 9MFY21 compared to Rs1,686.19 billion (-3.8% of GDP) in the same period last year.

 In FY16, Petrol & High Speed Diesel taxes averaged at $0.269 per litre. The Highest in dollar terms

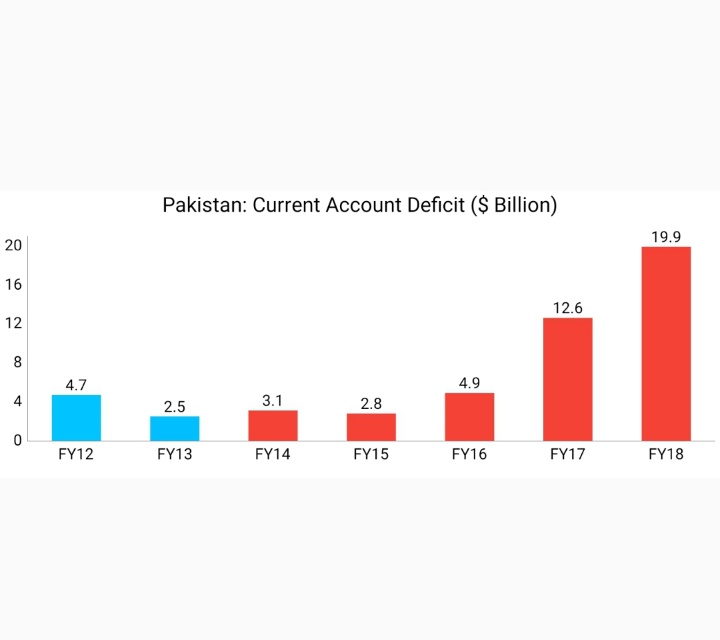
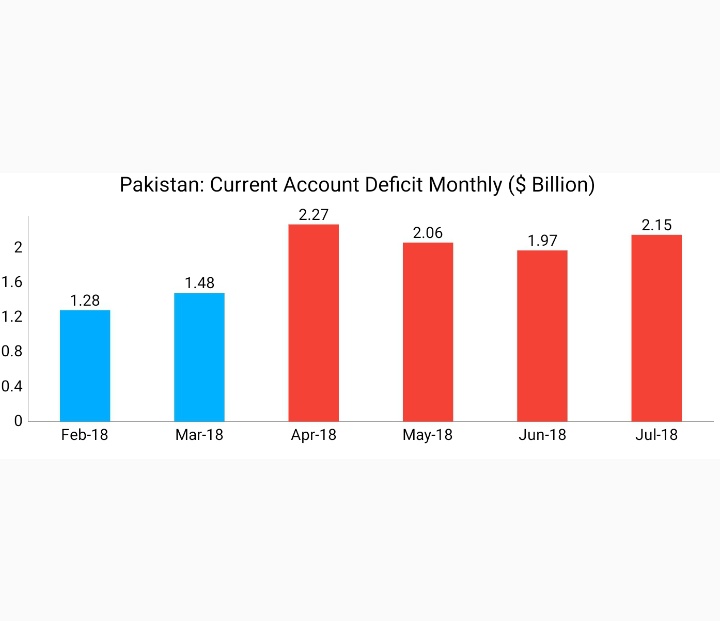
 Current Account Deficit (CAD) surged from 1.1% of GDP in FY13 to 6.3% of GDP in FY18