COVID-19 in IRELAND - updated 8th April.
A further 25 people have died from COVID-19 in Ireland.
Let’s view this a bit differently – I’ve plotted the same data 3 ways: 1. Log scale (has been the standard) 2. Linear scale 3. Per 100k People #coronavirus#Coronavirusireland
Most countries were experiencing exponential growth in early days of the spread, however in many countries the number of deaths is now increasing at a steadier rate. Using a linear scale can make sense – however it means that comparisons with smaller countries are difficult.
One obvious way to solve this is by viewing this per 100k people. The reason NI & ROI start off quite high in this chart is because we picked a common starting point of 10 deaths – and this was not weighted differently for each country.
• • •
Missing some Tweet in this thread? You can try to
force a refresh
The LEA map has been updated today here: covid19ireland-geohive.hub.arcgis.com
🔹Half of the top 50 LEAs are in Dublin.
🔹Donegal now has 4 LEAs in the top 50.
🔹Lifford-Stranorlar is still the highest.
>>>Breakdown per area included in this thread (1/5)
Here’s a view of how the % positive rate has changed over time.
Looking at NI first - you can see low numbers in June/July, and in August the number of cases and tests have both increased (at a similar rate).
In September this changed – and overall % rate is now increasing. 1/5
Here’s the same graphic for ROI.
Testing jumped up in July but cases stayed low. However, from August both tests and positive results are increasing. 2/5
Here’s both of these, side by side (and better quality).
A similar pattern as recently the positive rate pushes past 2% in the South, and close to 3% in the North. vimeo.com/460532319
3/5
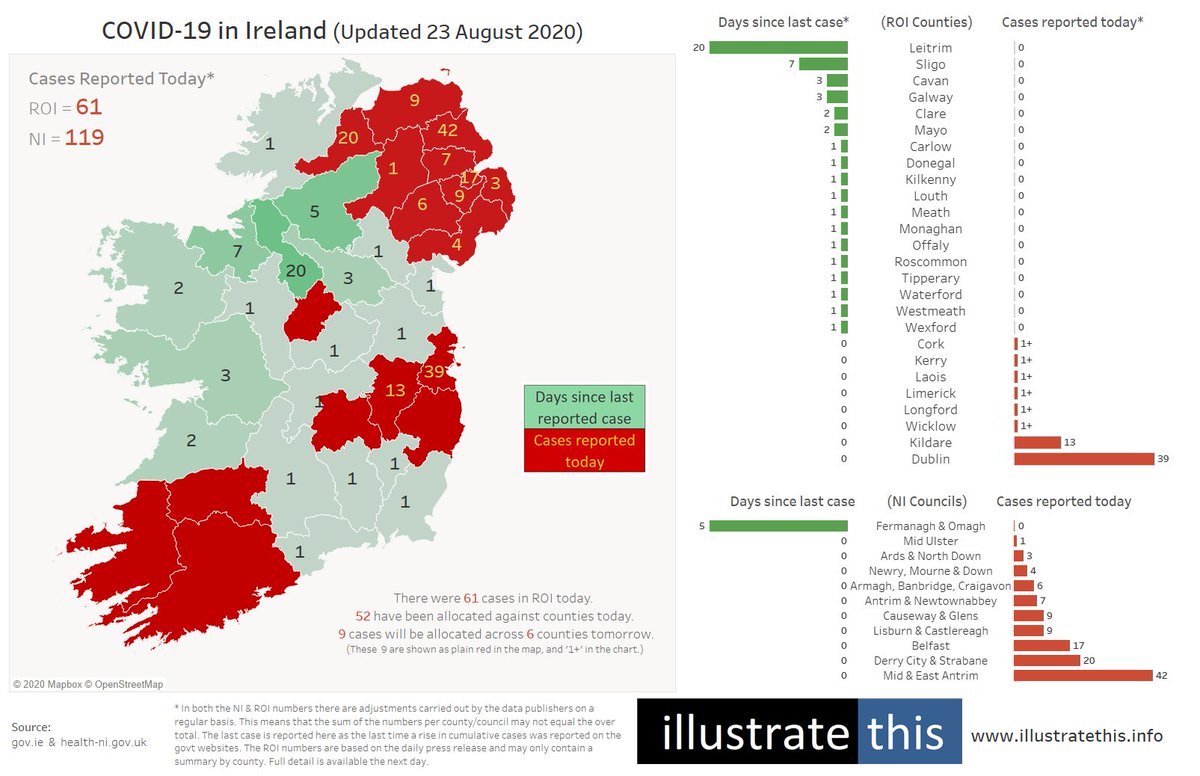
➡️Big jump in cases in NI. 119 in one day is the highest single day since April.
➡️This pushes the 7-day average in NI from 40 >> 54.
➡️Mid & East Antrim (42), Belfast (17).
➡️Big rise in Derry (20 today, average was 1/day).
➡️Lower cases today in ROI (see thread).
➡️In the Republic - quite similar trends over the last 3 weekends... high number of cases on Saturday, but lower on Friday/Sunday.
➡️Dublin (39) & Kildare (13) are highest again today.
➡️7-day average remains at 105/day
Here's the heat map for the last few weeks.
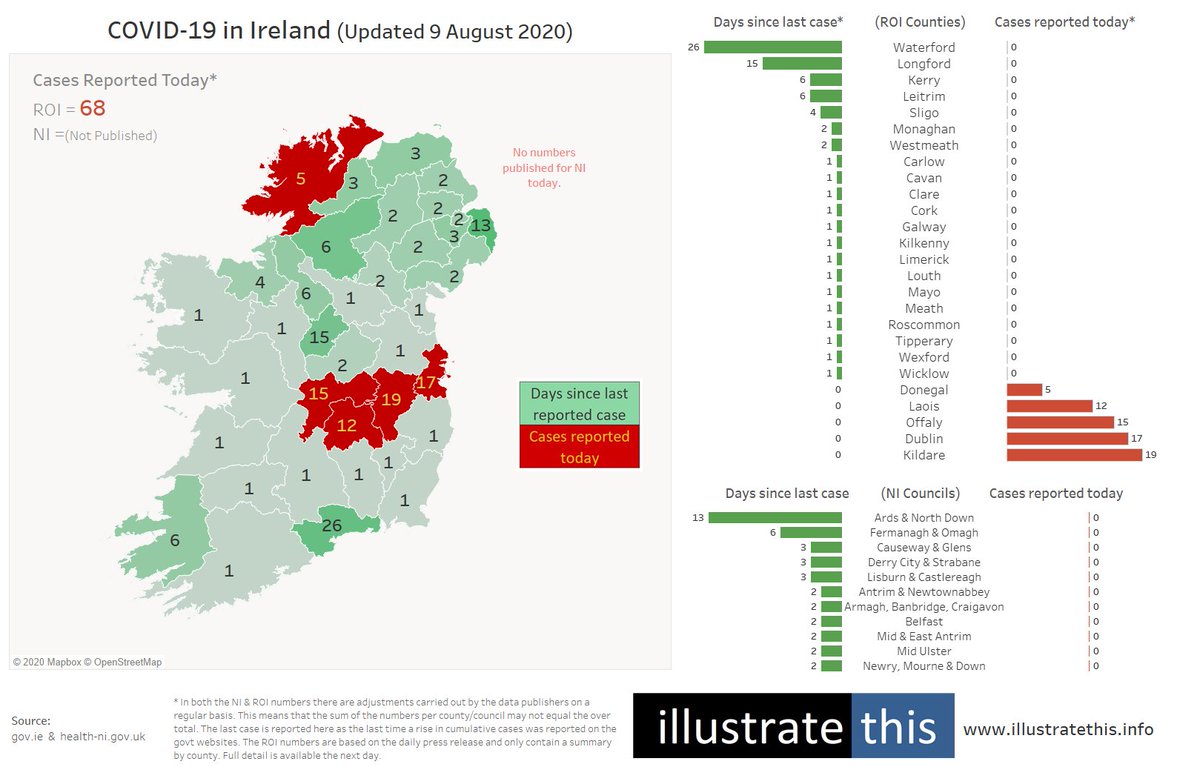
➡️Leitrim now 20 days without a case.
➡️This is now based on TODAY’s numbers (see thread).
➡️Total cases have dropped from 174 yesterday to 68 today.
➡️Only the 3 restricted counties have cases today + Dublin + Donegal.
➡️A big drop in Kildare numbers, but Laois & Offaly up.
🚫No NI numbers today 1/4
There has been some understandable confusion around which numbers are reported yesterday/today/tomorrow. It’s by far the question I’m asked most often. 2/4
Thankfully gov.ie are now publishing some county data on the same day that they report the total numbers (not just the day later).
Today they reported the counties in full, but over the last week or so they have at least been publishing some numbers. 3/4
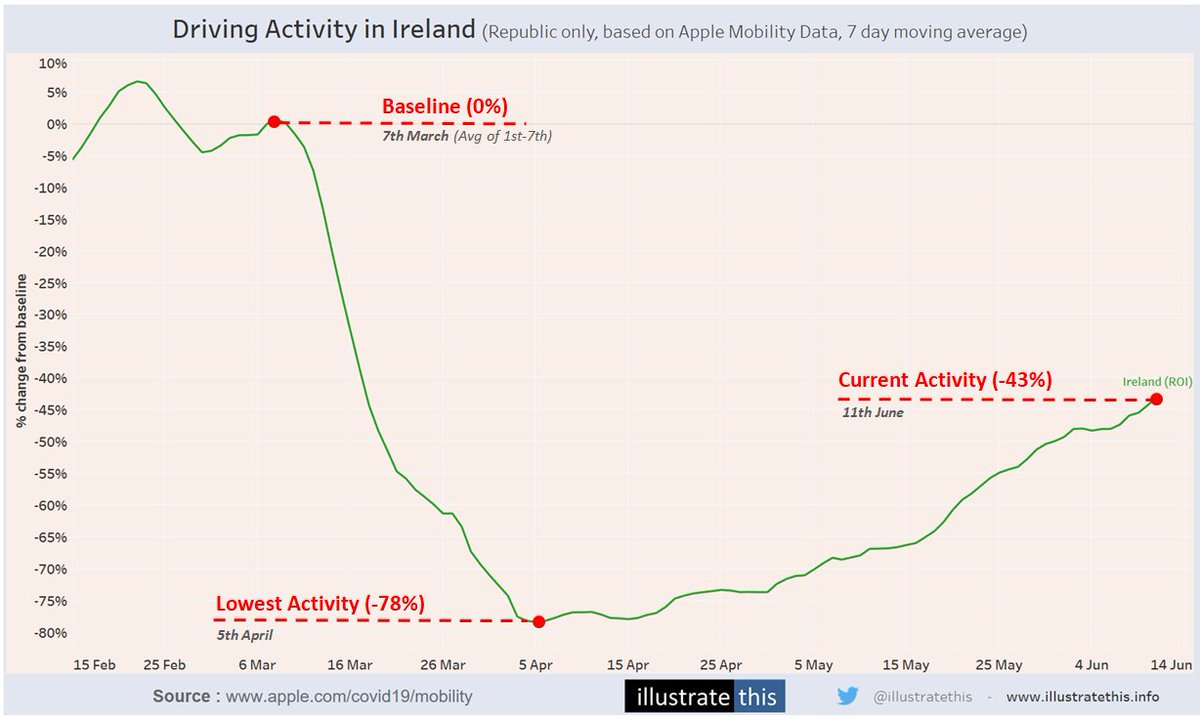
Are the roads back to normal?
Traffic in the Republic is currently 43% below pre-lockdown levels - this was 78% below in early April.
Traffic in NI is just 21% below pre-lockdown levels (and was only 17% a week ago).
Apple are actually showing traffic levels on 11th June as just 1% below baseline - (but their calculation is slightly different - see note later).
NI is closer to returning to 'normal' levels of traffic than any other part of Ireland/UK.
Surprising difference North vs South.