illustrate this Profile picture
I make things... charts, maps, animations. Mostly data-driven and Ireland related. Also, see data plots at @plot_this Contact me at brian@illustratethis.info
Oct 1, 2020 5 tweets 2 min read
The LEA map has been updated today here: covid19ireland-geohive.hub.arcgis.com
🔹Half of the top 50 LEAs are in Dublin.
🔹Donegal now has 4 LEAs in the top 50.
🔹Lifford-Stranorlar is still the highest.
>>>Breakdown per area included in this thread (1/5) Image Here's a breakdown of Dublin. (2/5) Image
Sep 22, 2020 5 tweets 2 min read
Here’s a view of how the % positive rate has changed over time.
Looking at NI first - you can see low numbers in June/July, and in August the number of cases and tests have both increased (at a similar rate).
In September this changed – and overall % rate is now increasing. 1/5 Here’s the same graphic for ROI.
Testing jumped up in July but cases stayed low. However, from August both tests and positive results are increasing. 2/5
Aug 23, 2020 4 tweets 2 min read
➡️Big jump in cases in NI. 119 in one day is the highest single day since April.
➡️This pushes the 7-day average in NI from 40 >> 54.
➡️Mid & East Antrim (42), Belfast (17).
➡️Big rise in Derry (20 today, average was 1/day).
➡️Lower cases today in ROI (see thread). Image ➡️In the Republic - quite similar trends over the last 3 weekends... high number of cases on Saturday, but lower on Friday/Sunday.
➡️Dublin (39) & Kildare (13) are highest again today.
➡️7-day average remains at 105/day Image
Aug 9, 2020 4 tweets 1 min read
➡️This is now based on TODAY’s numbers (see thread).
➡️Total cases have dropped from 174 yesterday to 68 today.
➡️Only the 3 restricted counties have cases today + Dublin + Donegal.
➡️A big drop in Kildare numbers, but Laois & Offaly up.
🚫No NI numbers today 1/4 Image 
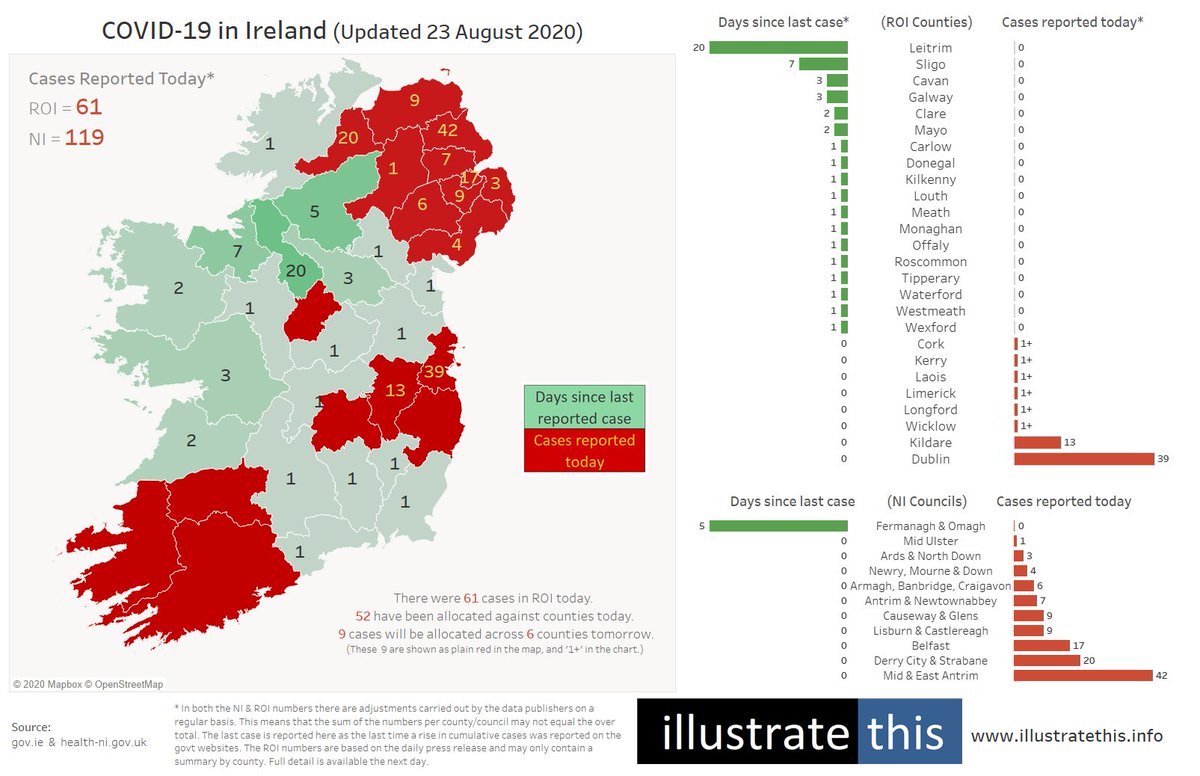
There has been some understandable confusion around which numbers are reported yesterday/today/tomorrow. It’s by far the question I’m asked most often. 2/4
Jun 13, 2020 5 tweets 2 min read
Are the roads back to normal?
Traffic in the Republic is currently 43% below pre-lockdown levels - this was 78% below in early April. Image 
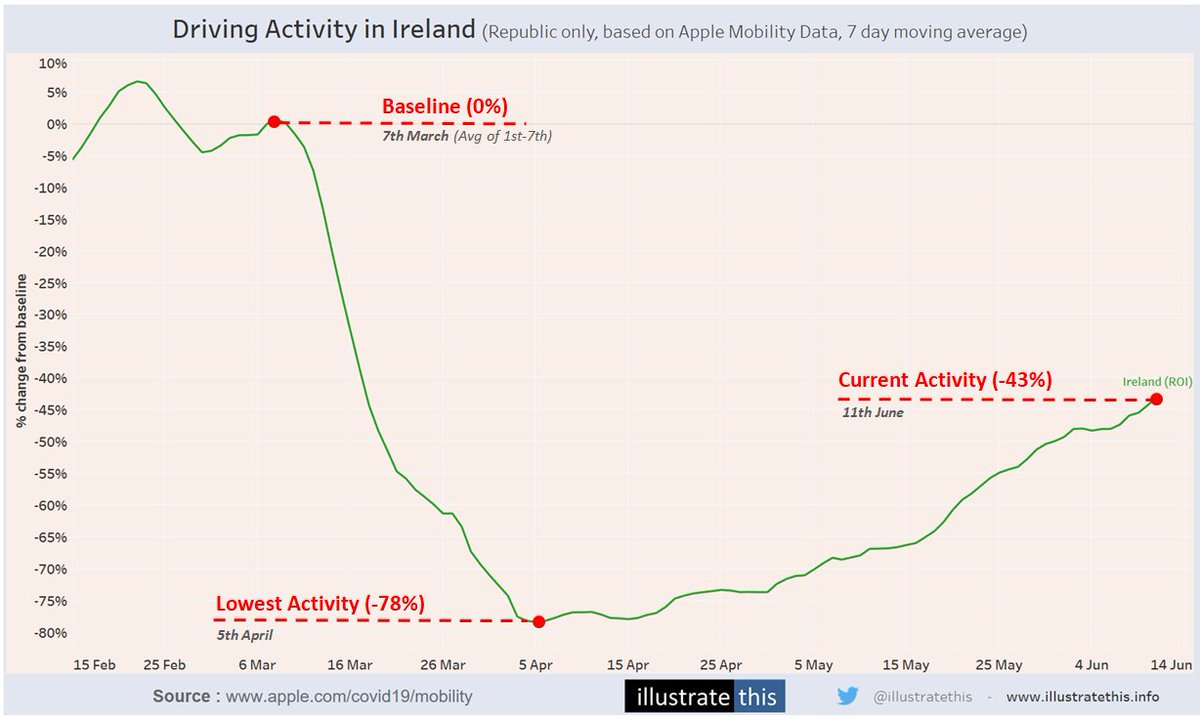
Traffic in NI is just 21% below pre-lockdown levels (and was only 17% a week ago).
Apple are actually showing traffic levels on 11th June as just 1% below baseline - (but their calculation is slightly different - see note later). Image