
I did some mathematical analysis of the IMHE model. EVEN IF we assume deaths are normally distributed, this model has some serious numerical stability problems.
#Mathematics #COVIDー19
#Mathematics #COVIDー19
With a (relatively low) 500 points generated N(0,10), the best-fit sigmoid for the data we do have varies wildly during the early phase of an epidemic. No wonder the estimate is jumping so much day-by-day!
#mathematics
#mathematics
Kicking it up to 5000 points generated N(0,10), we once again get a whole lot of jumping about until we approach the middle of the pandemic.
#mathematics
#mathematics
At 50,000 points it becomes clear that the model is fairly consistently optimistic, and tends to underestimate the true sigmoid's height until shortly after the epidemic reaches its peak.
At 1 million cases--we're now in the nation-wide scale for the model instead of cities or states--the optimal parameters continue to waver erratically.
See, when I started this little bit of research, I assumed there must be *some* scale on which the sigmoid model would work out---but no! At essentially any scale, the best-fit sigmoid model that the IMHE uses seems incapable of predicting the peak of the pandemic.
There's actually a very interesting mathematical reason why this occurs too: in some sense, the tails of normal distributions are approximately self-similar.
#mathematics #COVIDー19
#mathematics #COVIDー19
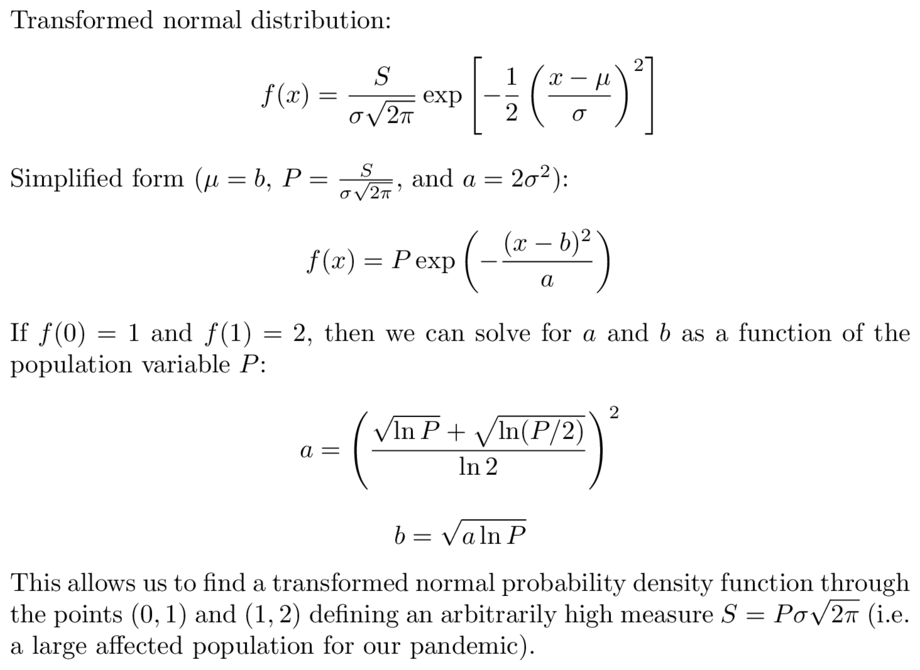
To see this, let's assume we've got a presumed transformed normal distribution P erf(a(x-b)), and it has some limited data we know about one of its tails: f(0)=1 and f(1)=2. Then we can get a family of transformed normals using a,b as functions of P.
#Mathematics #COVIDー19
#Mathematics #COVIDー19
Now, what happens as we vary P?
Well, naturally, the peak of the distribution gets higher and higher.
Well, naturally, the peak of the distribution gets higher and higher.
Now, what *doesn't* happen as we vary P?
Let's zoom in on the interval [0,1]...
Very little changes in this region! In other words, we can find a transformed normal N(a',b',P') which approximates our original normal N(a,b,P) for an arbitrarily large P'!
Let's zoom in on the interval [0,1]...
Very little changes in this region! In other words, we can find a transformed normal N(a',b',P') which approximates our original normal N(a,b,P) for an arbitrarily large P'!
More directly, observe that increasing P to absolutely ludicrous levels hardly affects the curve at all on [0,1].
As interpretation: The little stretch of data we know, if it's on a tail of the normal distribution, could be basically *anywhere* in the pandemic's course.
As interpretation: The little stretch of data we know, if it's on a tail of the normal distribution, could be basically *anywhere* in the pandemic's course.
If a pandemic behaves in the way IMHE assumes it does, then we can never REALLY predict how bad the pandemic is going to get until it starts reaching its peak. By assuming a normal distribution, they make their own problem impossible!
#Mathematics #COVIDー19
#Mathematics #COVIDー19
Gosh-darn it, I just realized I got all of my legends swapped around for the most recent batch of GIFs: P=5 is the dotted line, the blue line is the one that varies.

