I've realised that some highly educated people find formulae like this difficult to understand. 
Yet at the same stage we studied that level in math, we were also studying "water is H2O" in chemistry and "the heart has 4 chambers" in biology.
Somehow we don't find the latter two things baffling now.
Somehow we don't find the latter two things baffling now.
What is the formula for this shape?
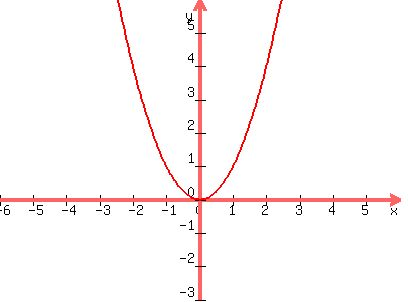
y = what?
To the far left and far right, it becomes very very large.
Now think about another formula:
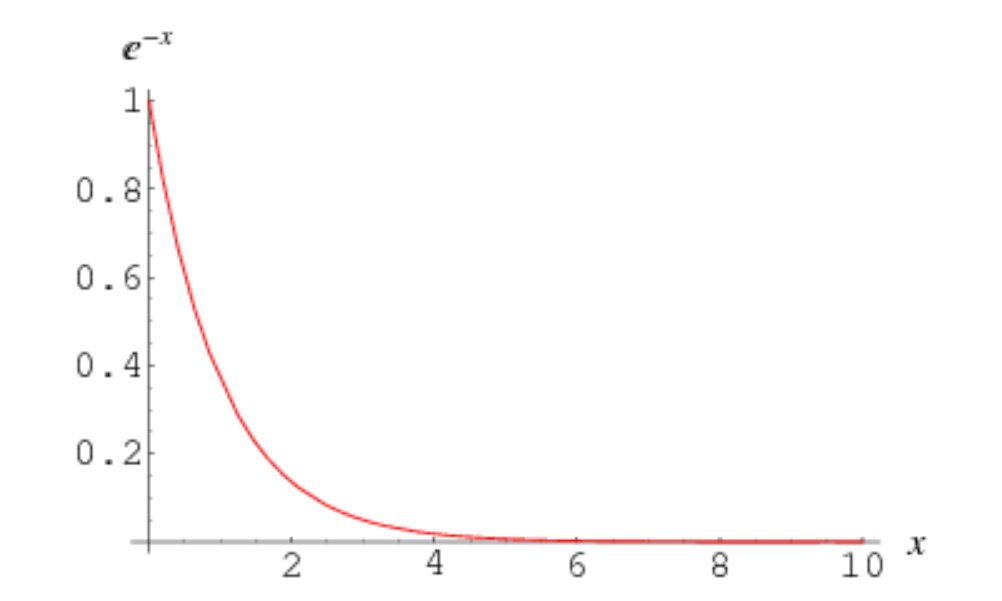
y = e^(-x)
When x is 0, y = e^0. Anything to the power 0 is 1.
When x is 1, y = e^-1, i.e. 1/2.718...
When x is 2, y = e^-2, i.e. 1/(2.718... squared)
This gets very, very small, very quickly.
y = e^(-x)
When x is 0, y = e^0. Anything to the power 0 is 1.
When x is 1, y = e^-1, i.e. 1/2.718...
When x is 2, y = e^-2, i.e. 1/(2.718... squared)
This gets very, very small, very quickly.
If we stick the two formulae together, we get this effect.
Input Square it then E to the power minus it
0 -> 0 -> 1
1 -> 1 -> 0.37
-1 -> 1 -> 0.37
2 (or -2) -> 4 -> 0.018
3 or -3 -> 9 -> 0.0001
Input Square it then E to the power minus it
0 -> 0 -> 1
1 -> 1 -> 0.37
-1 -> 1 -> 0.37
2 (or -2) -> 4 -> 0.018
3 or -3 -> 9 -> 0.0001
The result is a shape that is symmetrical.
1 in the middle, and decays away, gradually at first (going down to 37% when you are at x=-1 or +1) and then faster (down to 2% at x=-2 or +2; 0.01% at x=-3 or +3).
1 in the middle, and decays away, gradually at first (going down to 37% when you are at x=-1 or +1) and then faster (down to 2% at x=-2 or +2; 0.01% at x=-3 or +3).
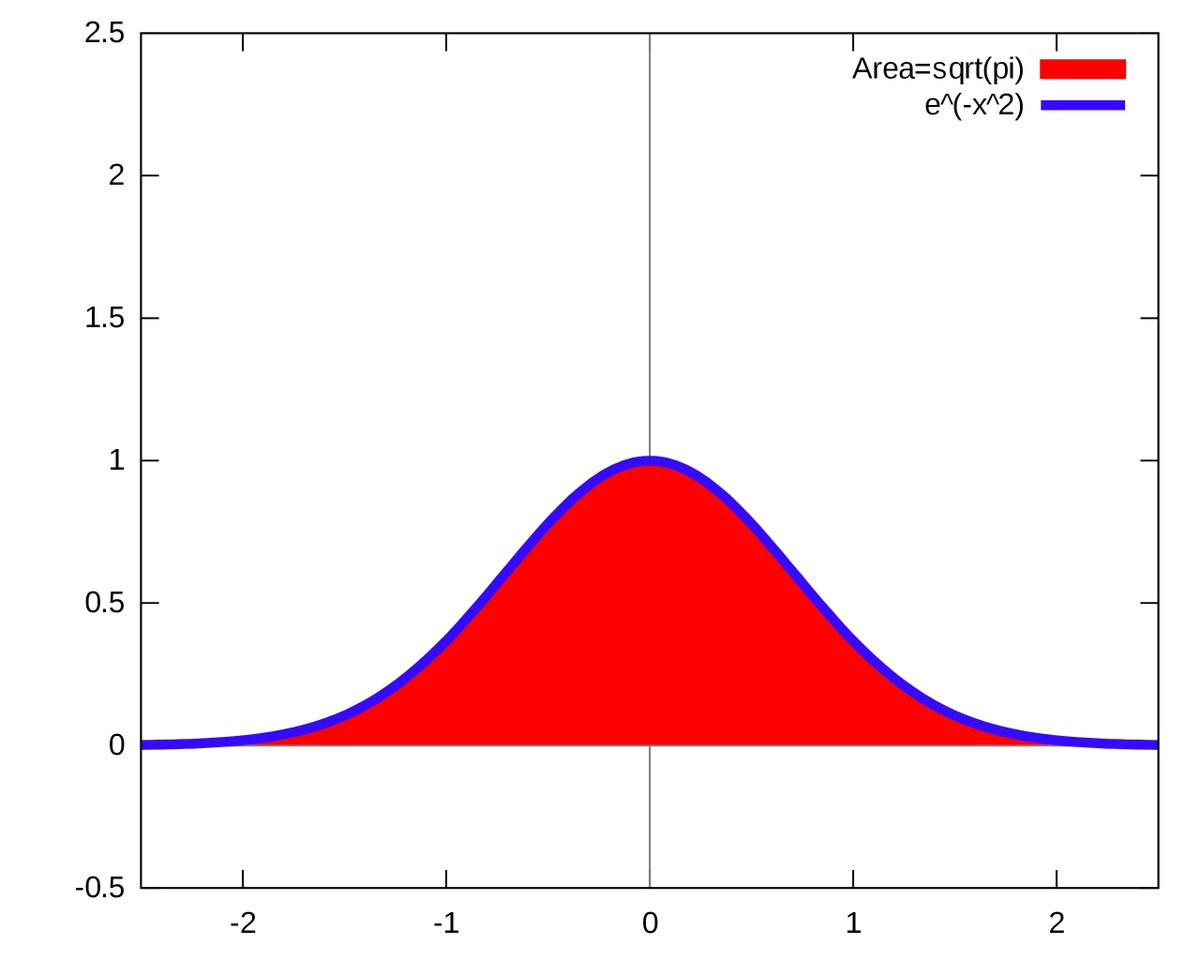
Aha! This turns out to be the fundamental formula of the normal distribution:
y = e^(-x squared)
y = e^(-x squared)
Trouble is, a probability density function has to have an area of 1, and this one doesn't. We need to scale down the y axis a bit.
Also, it would be nice if the x axis was in units of "standard deviation", i.e. +/-1 were + and - one standard deviation.
So we add some scaling.
Also, it would be nice if the x axis was in units of "standard deviation", i.e. +/-1 were + and - one standard deviation.
So we add some scaling.
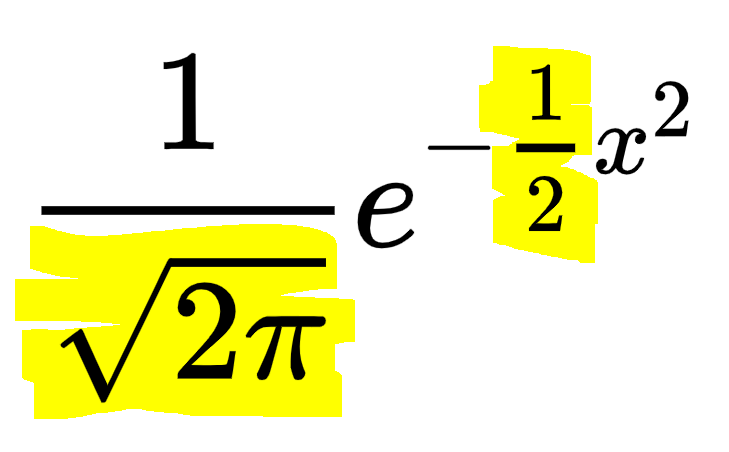
God only knows why the scaling factor is square root of 2 pi.
But it is.
But it is.
So now you can make a normal distribution any time you want, e.g. at a party or whatever, with the above formula.
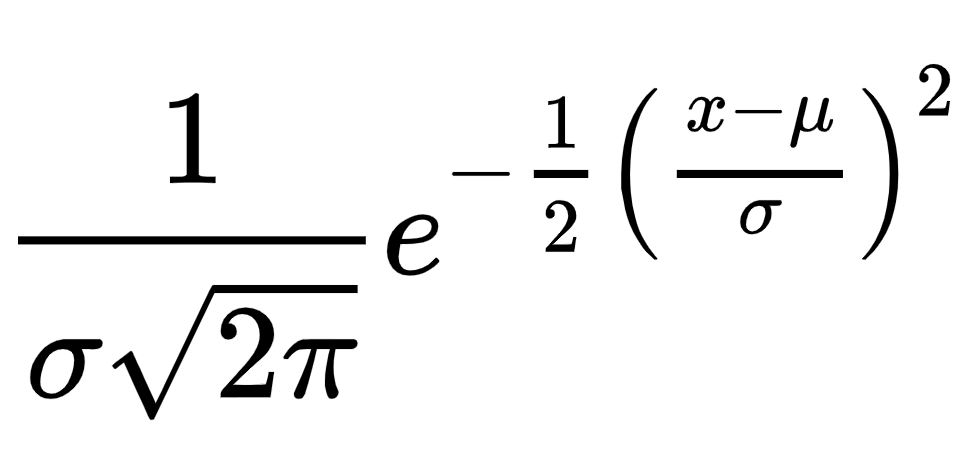
But what if you want to be able to adjust the mean and standard deviation, and apply it to real life variables, like height?
But what if you want to be able to adjust the mean and standard deviation, and apply it to real life variables, like height?
That's easy, you start with your raw biological variable and:
STEP 1. Subtract the mean
STEP 2. Divide by the standard deviation
Quiz
If you take a sample of data, calculate the mean, and subtract that mean from each number, what is the mean of the results you get?
STEP 1. Subtract the mean
STEP 2. Divide by the standard deviation
Quiz
If you take a sample of data, calculate the mean, and subtract that mean from each number, what is the mean of the results you get?
And if you take a load of data, calculate the SD, and then make a new set of data by dividing the original set of data by its SD, what is the SD of the new data?
So if you
STEP 1.
Take a raw biological value of one person, like "1.82 metres", subtract the mean of the group which might be "1.62 metres", you get what?
STEP 1.
Take a raw biological value of one person, like "1.82 metres", subtract the mean of the group which might be "1.62 metres", you get what?
And then
STEP 2.
Divide by the SD, which happens to be "0.10 metres", what do you get?
STEP 2.
Divide by the SD, which happens to be "0.10 metres", what do you get?
And that's all this is saying.
Step 1. Subtract the mean
Step 2. Divide by the SD
Step 3. Apply e^(-0.5 x)
Step 4. Divide by SD*sqrt(2 pi)
Step 1. Subtract the mean
Step 2. Divide by the SD
Step 3. Apply e^(-0.5 x)
Step 4. Divide by SD*sqrt(2 pi)
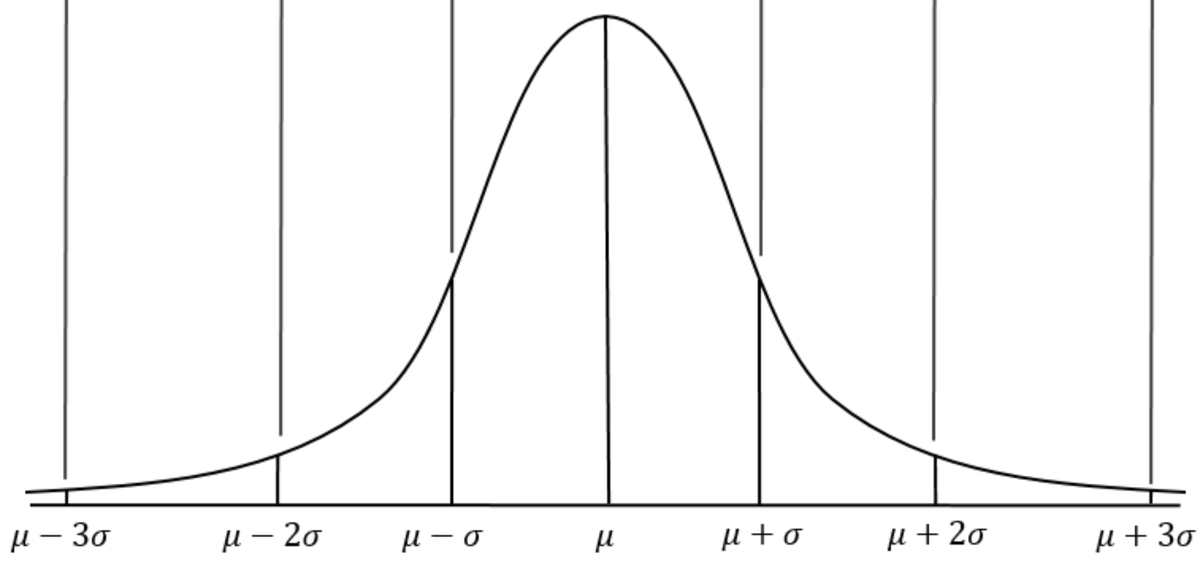
The shape of it is this.
It is scaled correctly, with a mean of mu and a standard deviation of sigma, and an area of 1.
It is scaled correctly, with a mean of mu and a standard deviation of sigma, and an area of 1.
In clinical practice we want to know the area of a part of this, i.e. "how likely is it that a random item will be in this range from here to here?"
That is the CUMULATIVE distribution function
That is the CUMULATIVE distribution function
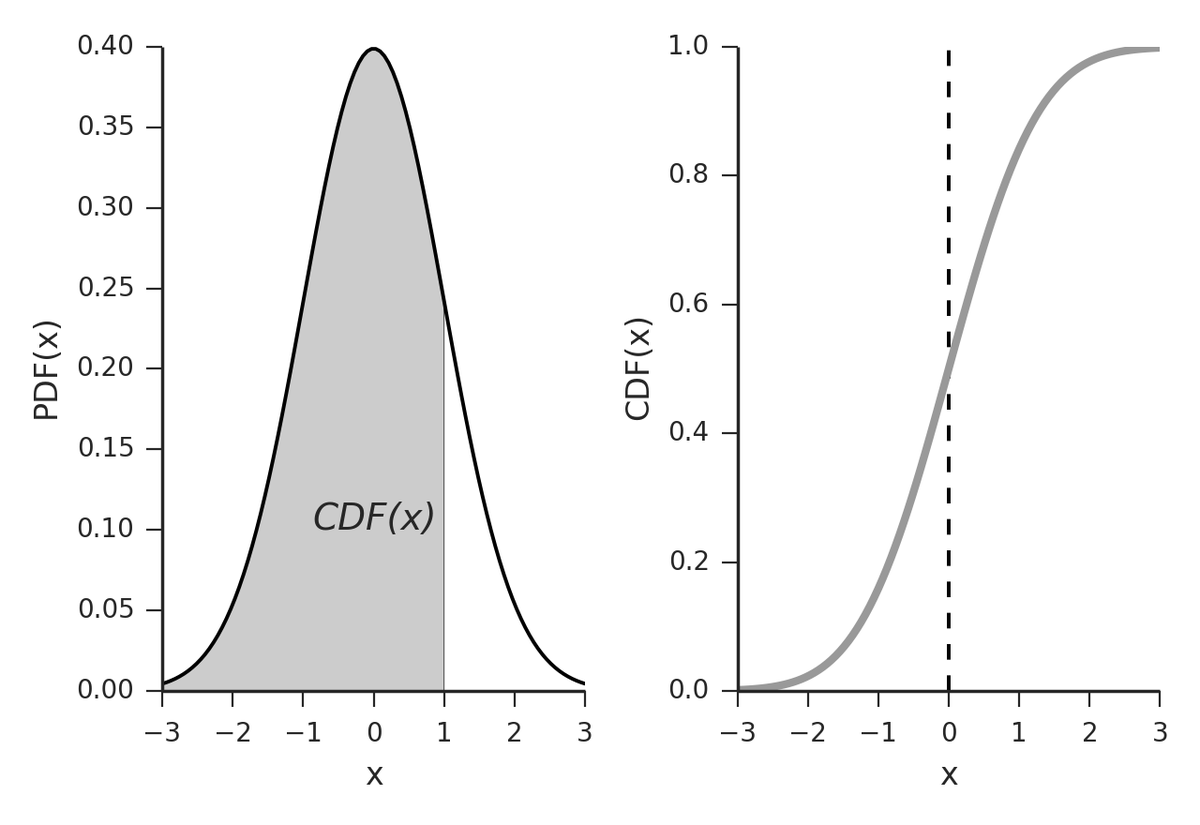
The symbol for calculating the area under a curve is this:
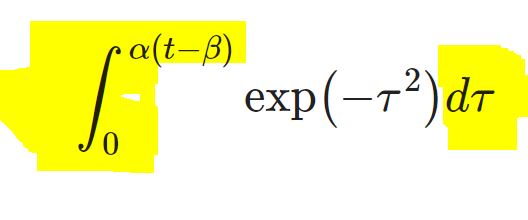
So that gives us this formula:
At the far left (distant past), it is minus 1.
At the far right (far future), it is plus 1.
In the middle, at time "beta", representing mid-epidemic, it is zero.
At the far right (far future), it is plus 1.
In the middle, at time "beta", representing mid-epidemic, it is zero.
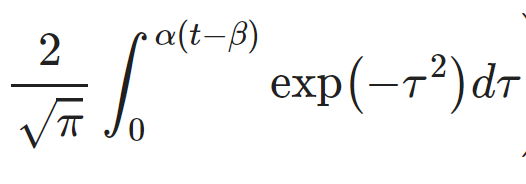
It's not quite what we want. We need to rescale that result, so that it
starts at 0% infected, not "-1"
ends at only a fraction "p" infected, not 100%.
Step 1. Add 1.
That fixes the start to be 0, not -1.
But the end is not 2, not p.
starts at 0% infected, not "-1"
ends at only a fraction "p" infected, not 100%.
Step 1. Add 1.
That fixes the start to be 0, not -1.
But the end is not 2, not p.
So
Step 2. Multiply by p/2.
This gives this formula.
Step 2. Multiply by p/2.
This gives this formula.
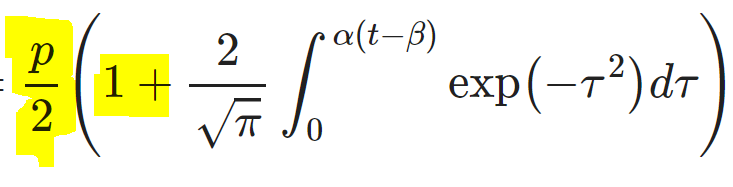
That's literally all there is to it.
The right hand part says "normal distribution"
The left hand part says "scaled to go from 0 to some proportion p"
The right hand part says "normal distribution"
The left hand part says "scaled to go from 0 to some proportion p"
All the phenomena being discussed in the formula are familiar to all of us.
We just couldn't all read it when written in efficient mathematical terminology.
We just couldn't all read it when written in efficient mathematical terminology.
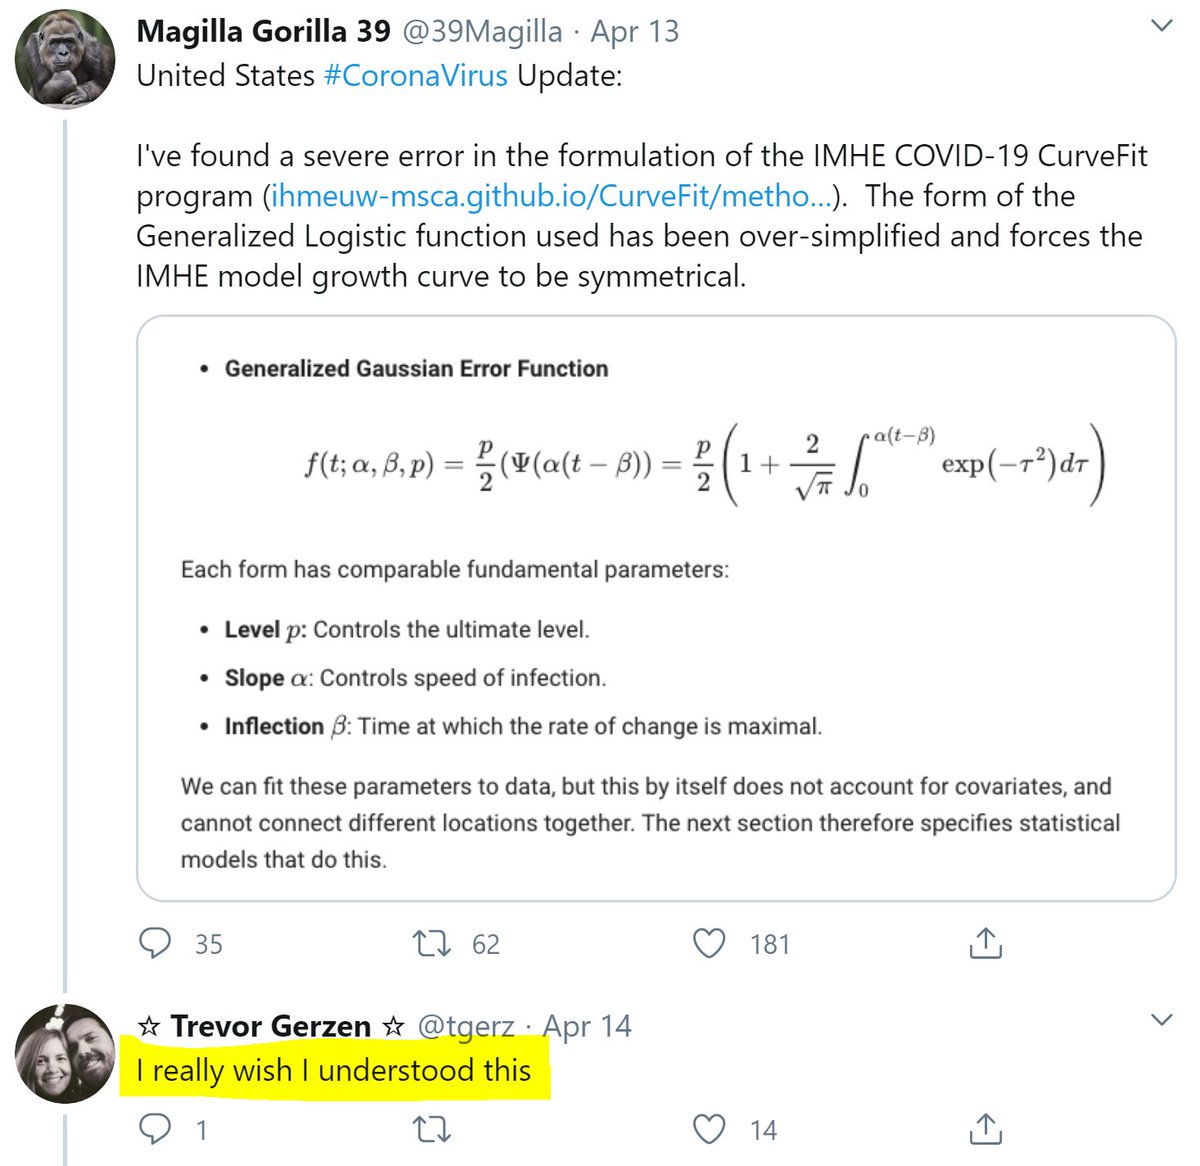
If readers had not skipped over the "mathsy bit" when reading about model predictions, would have quickly pointed out to those advocating the models, that there is no reason to think the downslope is anything like the upslope.
So let's give thanks to people who take the time to look in to things, and invest in their own understanding of the world.
The [good bits of the] world is made by them!
The [good bits of the] world is made by them!