1/ Chart Study from the Dragon's Den. This will take me a little bit and I might have to finish tomorrow but let's see how far I get. I'll note when it is complete.
2/ First a little wave intro. Be aware, I think Elliott Wave is pure GARBAGE under Prechter's "theory". Most people don't use it correctly, break rules, etc to force counts. It is also not a "theory" because it is based on absolutely nothing for proof. It all based on looks.
3/ Ask anyone 1 question when they put out a count - why? No one can answer that because EW is not based on data. It's a guess, pure and simple. That said, the market is in fact, structured based on patterns, it's just not a nested 5 wave pattern.
4/ That 5 wave impulse - or at least the character of those segments - is important though and makes up segments of structure. These are key elements. 

5/ A variation of that 5 wave impulse is the ABC-X-ABC pattern as shown here. Only the one on the left is a true impulse whereas the other is really a 3 wave pattern

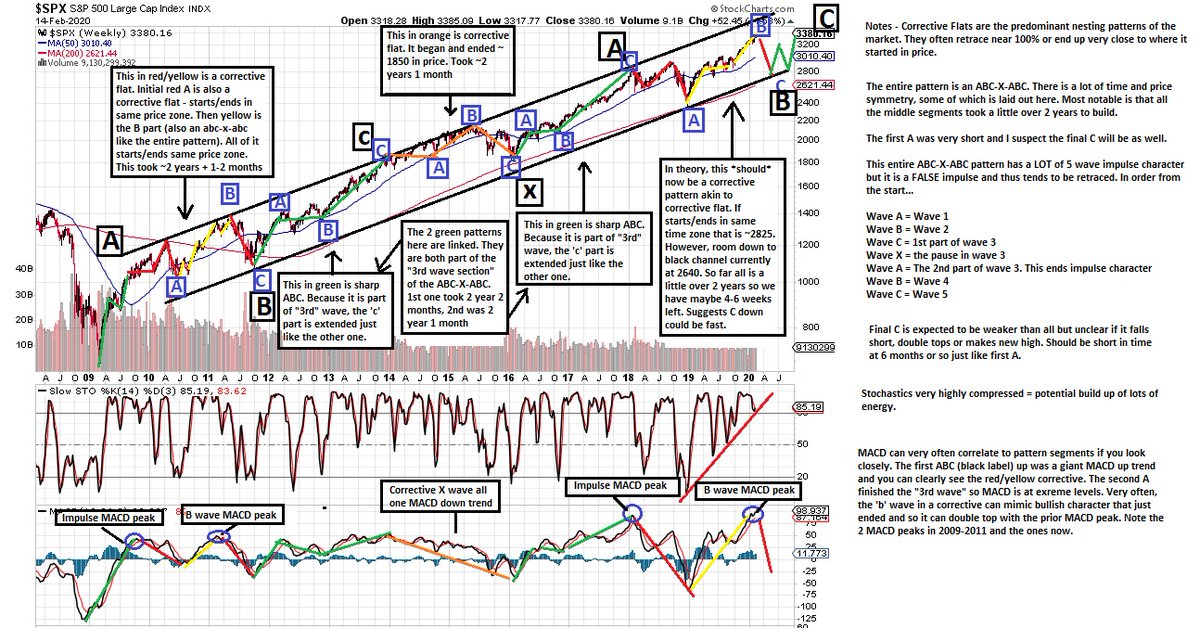
6/ Impulses don't nest across the market well. However, corrective flats do. George Lindsay original came up with the pattern, except he only applied it to a specific time frame. Fact is it nests across many time frames and found as parts within itself. This is the pattern.

7/ There is some variability in the pattern. One is how the 3 peaks part, or the A of the entire ABC flat, forms. It can be 2 or 3 peaks. In fact, on the right, the A can also be a flat, and the 'a' of that A can be a nested flat and so on.

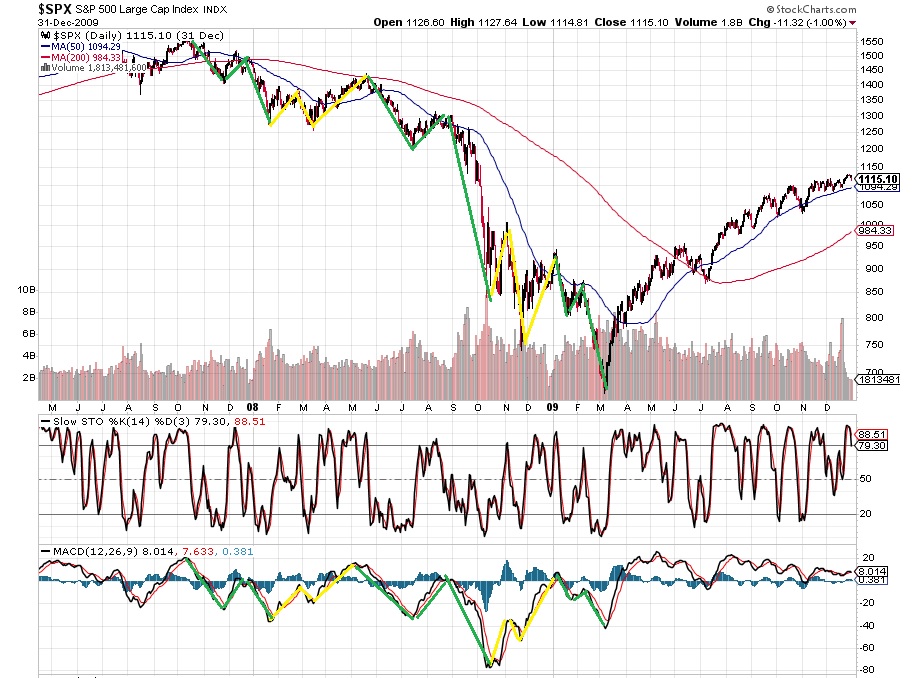
8/ Another place we find variability is in the C wave down. At times, it can be 3 waves like it was in the 1929-1932 decline. Other times, it can be 5 waves. This was the C wave from 2007-2009. There are lots of other examples though if you look for them. This is the big picture.

9/ Let's focus on the B wave of that corrective flat now. Remember, this is a FAKE impulse but it does retain character of impulse elements. That character is important in identifying parts but you CAN apply some proof of principle with actual DATA. This is 2009 - 2020

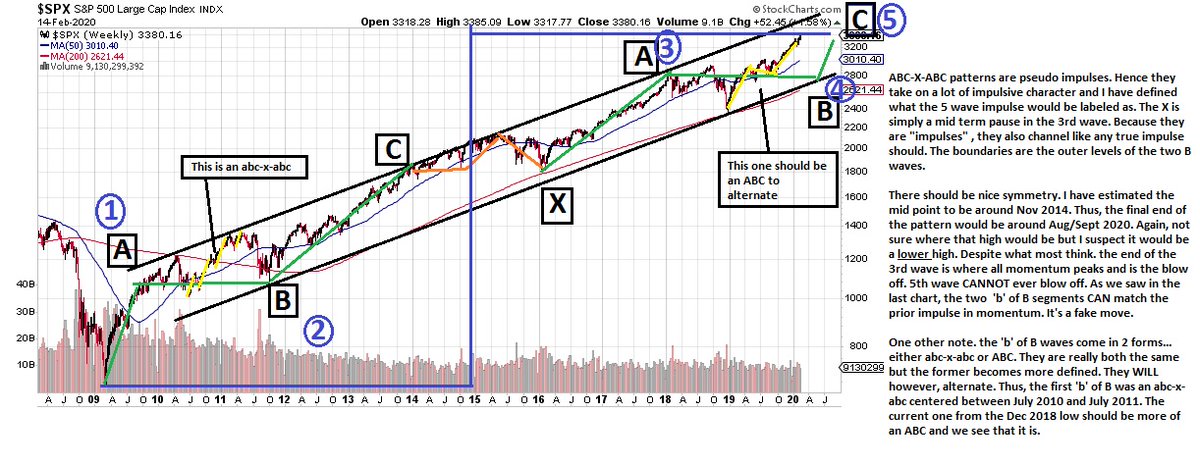
10/ Remember, a TRUE impulse will channel. Even though the ABC-X-ABC is not an impulse, it retains character of one. That means the two B waves are = W2 and W4. Thus, the pattern channels on those boundaries. 2009-2020 channeled perfectly.
11/ When you break the lower channel line, the pattern is COMPLETE and this drop did do that as it fell from S&P 3400 to 2100. Thus, there will be NO NEW ATH until the pattern completes which now needs a C drop back towards 2009 lows.
12/ Like it or not, believe it or not, it will happen and this one is TEXTBOOK. I have seen too many of these patterns always fulfill completion to ignore. MACD correlates. I have other actual data (no shown, not releasing) that also prove the concept on this monthly/weekly scale
13/ There are all sizes of these patterns throughout history and one thing I have noticed, the larger and more textbook it looks, the better it correlates to data, the more likely it holes and fulfills. And this one is HUGE. No FED or any govmt body will change its destiny.
14/ This corrective flat pattern since 2000 is 20 years in the making + the time leading up to it which is decades more. It is also the culmination of hundreds of trillions of $ of buy/sell actions forming rallies and declines.
15/ It is also made of hundreds of millions of individuals, entities etc over time providing the emotional backbone that form the character of all those pattern segments. There is not enough money or even printing ability to change this.
16/ I have lots more but will pause here for now. Maybe add a few more this evening and complete the rest tomorrow so check back as we focus on where we are now.
17/ One more for tonight...there are 3 layers of nested corrective flats here from 2009-2011. Can you seen them? More to come on Friday 4-18-20

18/ OK, let's pick up where I left off. What we see is that we are following a textbook 3 peaks pattern so far, aka corrective flat, from the year 2000. We broke the ABC-X-ABC channel so should now be in the C down back towards the 2009 low.
19/ We know the C down can unfold in one of 2 different ways - 3 waves down like 1920-1932 or 5 waves down like 2007-2009. I don't have the same type of data for back then, but it is plausible the 1929-1932 decline was also 5 waves as an ending diagonal here.

20/ One thing to note about all these 5 wave down patterns. There are NOT nested impulses but rather segments of 3 on each leg. The 1929 chart is outlined that way.
20/ The 2007-2009 C wave was also 5 waves down but each segment was 3 waves. Here we do have MACD to outline trend patterns and it correlates.
21/ So, where does that leave us? I think we are likely doing 5 waves down and have completed W1 down at the Mar 23 low and are now in a W2 structure. More on that in a bit.
22/ I previously mentioned that ideally, the first run down on the break of an ABC-X-ABC usually likes to hit the X wave region on the reversal. That is between S&P 1800-2100. Got close, but did not quite hit. HOWEVER....
23/ The DOW did hit it.

24/ Transports nearly broke through the other side. So depending on what you look at, there were varying degrees of "tagging".

25/ Here is where it gets REALLY interesting. If you factor in the $USD dollar, the S&P actually did a direct tag right in the middle. Whoa...that also tells me the USD is playing a role here and not surprising given the Fed printing press going into overdrive printing dollars.

26/ So, I think we got our X region tag after all. Now let's take a closer look at the C wave decline from 2007 because I think we are going to mimic that, only 1 degree higher/larger
27/ ** Here is the initial part of the 2007 drop side by side with the current drop. Ignore any 3 or 5 wave patterns. The take away is SIMILARITY in all the various segments. The drops, pauses, etc. Even MACD trend patterns.

28/ If the similarity holds, we should be turning soon for a 3 segment move towards 2400.
29/ Where does that leave us going out even further? As I said in the past, the 90 year cycle puts us on par with 1929. The excesses, debt, everything is at an extreme. We have a LONG way to go and the next 2 years are going to be VERY painful as we flush it all to start fresh.

30/ By the way, I should amend...W1 down may not be complete if we follow the 2007 - 2009 path. The next drop completes that which might coincidentally bring us into the X region without USD adjustment. Big pic looks like this.

31/ OK, I am done for now.