
THREAD: We hear that India is not testing enough for COVID19.
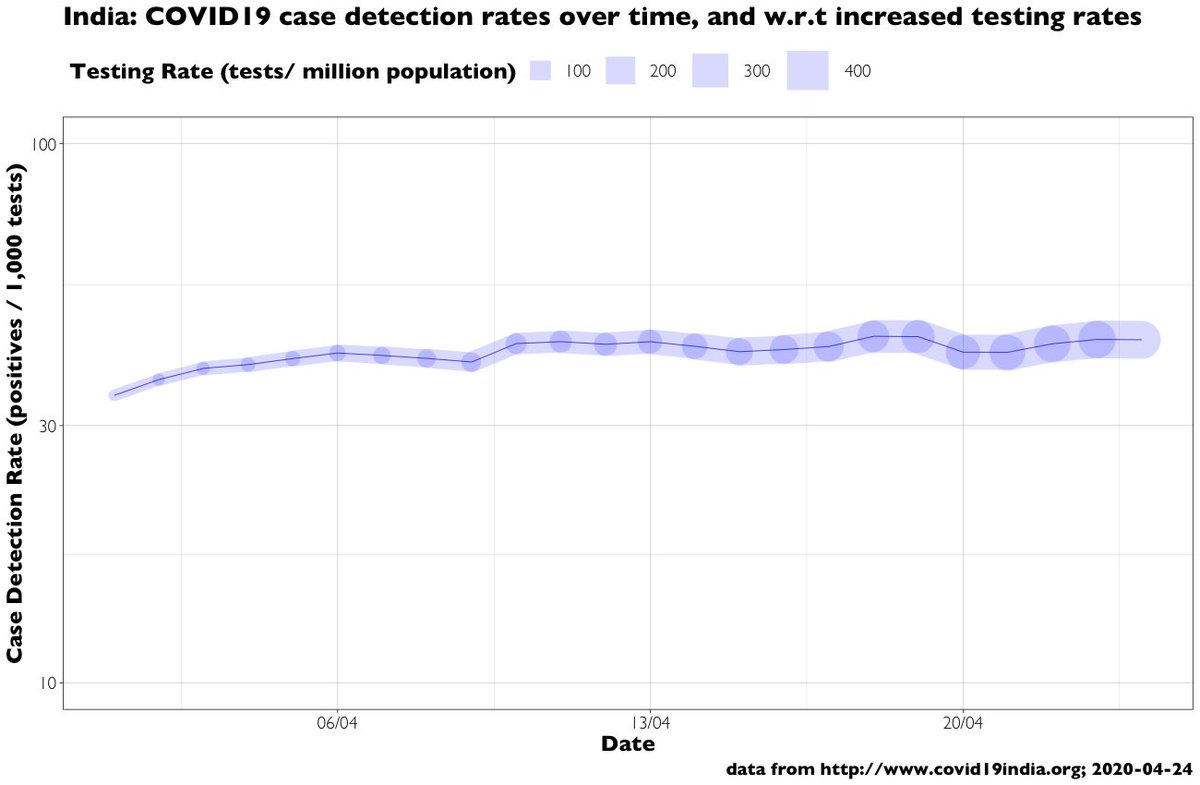
During April, our testing rates (line thickness in chart) grew c.11 fold: from 36 to 401 tests per million. Case detection rates (y-value), however, increased more slowly from 34 to 43 positives per thousand tests .
During April, our testing rates (line thickness in chart) grew c.11 fold: from 36 to 401 tests per million. Case detection rates (y-value), however, increased more slowly from 34 to 43 positives per thousand tests .
But that does not tell us enough about testing and case detection patterns across the country. Our states are very different, and so are their responses to the outbreak.
So, here are the patterns for our top 15 states (by cases), w.r.t. the national aggregate shown above.
So, here are the patterns for our top 15 states (by cases), w.r.t. the national aggregate shown above.

States in the top row account for nearly two-thirds of all cases. Currently, they’re testing at twice (847/mn) the national aggregate rate (401/mn), & have case reporting rates that are 50% higher than the national aggregate (with the exception of Rajasthan, which is 38% lower).
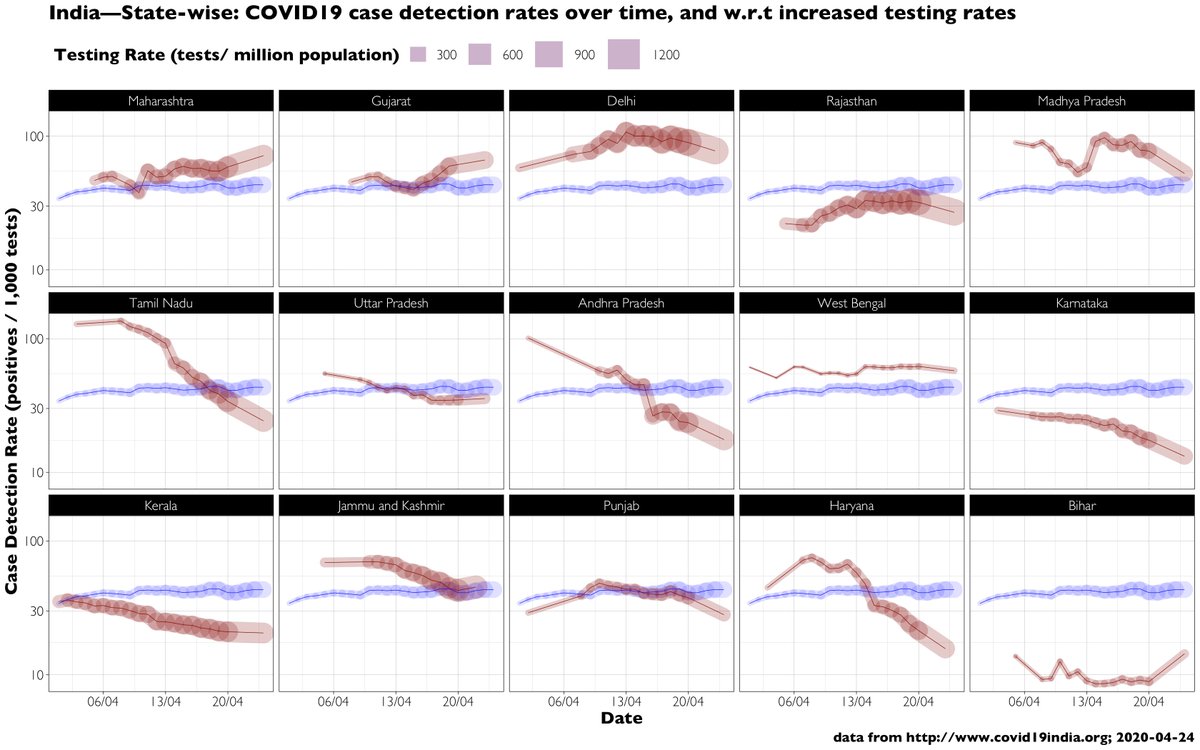
Southern states (TN, KL, KA & AP) and HR, while currently having testing rates of 636/mn (or 59% higher than the national aggregate), also show consistent declines in case reporting rates, with the latest median at 17.6 / 1000, which is 60% lower than the national aggregate.

Current testing rates in populous states like UP, WB and BR (143/mn) are 64% lower than the national aggregate, while case reporting rates match aggregate values. However, as is being seen with BR now, and was seen with MP earlier, these could change as testing rates increase.

If these trends are reliable (see caveats below), case detection rates are rising with testing rates in MH and GJ, while falling in the south. Yet, without knowing how additional testing capacity is being allocated, it is hard to comment on the larger value of ramping up testing.
Finally, how these testing and detection rates translate into fatalities, or pressure on public health resources is complex. Still, useful to know that some of the worst-impacted countries have tested 10-70 times higher than us, and had 2-7 times higher case detection rates.
Caveats:
— Test data are cobbled from multiple sources, and there's great ambiguity on whether they represent samples or persons. We’ll never know.
(Digression: how I wish the GoI cared enough to have an initiative to obtain, curate, and disseminate disaggregated COVID19 data!)
— Test data are cobbled from multiple sources, and there's great ambiguity on whether they represent samples or persons. We’ll never know.
(Digression: how I wish the GoI cared enough to have an initiative to obtain, curate, and disseminate disaggregated COVID19 data!)
Caveats (cont’d):
— Across states, how was testing effort allocated to its population? How strictly was it based on the ICMR testing guidelines? If testing was targeted, case detection rates are likely to be higher than if testing was less so. We’ll never know.
— Across states, how was testing effort allocated to its population? How strictly was it based on the ICMR testing guidelines? If testing was targeted, case detection rates are likely to be higher than if testing was less so. We’ll never know.
Caveats (cont’d):
— It is impossible to say from aggregate data how the increases in a state's testing capacity were allocated on the ground. Was it used to intensify testing in known outbreak areas? Or did it lead to expansion of testing to newer places? We’ll never know.
END
— It is impossible to say from aggregate data how the increases in a state's testing capacity were allocated on the ground. Was it used to intensify testing in known outbreak areas? Or did it lead to expansion of testing to newer places? We’ll never know.
END

