
US Coronavirus Update for Friday, April 24, 2020
~ A divided day
Fatalities first ~
• Total US covid-19 deaths as of Fri, Apr 24: 51,192
• Increase in last 24 hours: 1,334 (+ 3%)
--> Smallest absolute increase in deaths in one day since Apr 6 (18 days)
~ A divided day
Fatalities first ~
• Total US covid-19 deaths as of Fri, Apr 24: 51,192
• Increase in last 24 hours: 1,334 (+ 3%)
--> Smallest absolute increase in deaths in one day since Apr 6 (18 days)
2/ Deaths increased 1,334 on Friday — over a previous total of 49,858.
As a percent increase, that's: + 2.68%
In rough terms, that's like having had 50 deaths, and adding just 1.
Friday was the lowest percent increase in deaths, in the US, since the outbreak began.
As a percent increase, that's: + 2.68%
In rough terms, that's like having had 50 deaths, and adding just 1.
Friday was the lowest percent increase in deaths, in the US, since the outbreak began.
3/ How is that even possible? In the early days of the outbreak, here's how death totals progressed.
Total US deaths (new deaths in parenthesis):
Mar 1: 1 (1)
Mar 2: 6 (5)
Mar 3: 9 (3)
Mar 4: 11 (2)
Mar 5: 12 (1)
Mar 6: 15 (3)
Mar 7: 19 (4)
Mar 8: 22 (3)
Total US deaths (new deaths in parenthesis):
Mar 1: 1 (1)
Mar 2: 6 (5)
Mar 3: 9 (3)
Mar 4: 11 (2)
Mar 5: 12 (1)
Mar 6: 15 (3)
Mar 7: 19 (4)
Mar 8: 22 (3)
4/ When the number of deaths is that small, every death is a big jump in percentage.
US added 1 death — on a day it had only 12: + 8.3%
US added 3 deaths — on a day it had only 19: + 16%
US deaths haven't increased 16% in 2 weeks, haven't increased 8% in a week.
US added 1 death — on a day it had only 12: + 8.3%
US added 3 deaths — on a day it had only 19: + 16%
US deaths haven't increased 16% in 2 weeks, haven't increased 8% in a week.
5/ Recall deaths increased on Thursday (4/23) by 3,092 — a big jump resulting from New York reclassifying deaths & adding several days' worth at once.
Friday's total — 1,334 — was a drop even compared to the running 5-day average, leaving out Thurs spike: 1,916.
Friday's total — 1,334 — was a drop even compared to the running 5-day average, leaving out Thurs spike: 1,916.
6/ Is this good news? Breaking through to a new lower daily death plateau?
One day is not a trend, or even a signifier, as we've learned. It's an alert.
But I looked at death totals for every state, and none of the big states (CO, FL, NJ, NY, TX) had a dramatic fall.
One day is not a trend, or even a signifier, as we've learned. It's an alert.
But I looked at death totals for every state, and none of the big states (CO, FL, NJ, NY, TX) had a dramatic fall.
7/ Pennsylvania reported 0 deaths. But it often goes in clusters of days — a low number, then a higher number, as if reporting is bumpy. And PA running < 100 deaths a day.
A glimmer of optimism.
As we have noted repeatedly: A lot of days of 30,000 new cases to work through…
A glimmer of optimism.
As we have noted repeatedly: A lot of days of 30,000 new cases to work through…
8/ Now, new cases.
• Total confirmed US cases, Fri, April 24: 898,220
• Increase in cases in last 24 hours: 29,977 (+3%)
--> New cases rise compared to Thursday
--> Largest absolute increase in 6 days
--> New cases added are more than 25,000, on 10 of the last 11 days
• Total confirmed US cases, Fri, April 24: 898,220
• Increase in cases in last 24 hours: 29,977 (+3%)
--> New cases rise compared to Thursday
--> Largest absolute increase in 6 days
--> New cases added are more than 25,000, on 10 of the last 11 days
9/ Deaths fall. Cases rise — and not a little bit.
But with cases, the pattern has been consistent: Consistently inconsistent.
Let's go back to our pattern of arrows, on the next tweet.
But with cases, the pattern has been consistent: Consistently inconsistent.
Let's go back to our pattern of arrows, on the next tweet.
10/ Cases up or down, compared to previous day, starting Sat, Apr 11:
4/24 ↑
4/23 ↓
4/22 ↑
4/21 ↓
4/20 ↑
4/19 ↓
4/18 ↑
4/17 ↓
4/16 ↑
4/15 ↑
4/14 ↑
4/13 ↓
4/12 ↑
4/11 ↓
Alternate 8 days in a row. With the exception of 1 day (4/15), 14 in a row
4/24 ↑
4/23 ↓
4/22 ↑
4/21 ↓
4/20 ↑
4/19 ↓
4/18 ↑
4/17 ↓
4/16 ↑
4/15 ↑
4/14 ↑
4/13 ↓
4/12 ↑
4/11 ↓
Alternate 8 days in a row. With the exception of 1 day (4/15), 14 in a row
11/ And the new cases aren't alternating up and down, while creeping down slowly.
Trailing 5-day average:
Fri, 4/24: 27,930
Fri, 4/17: 28,511
We may be staying home.
We may be practicing social distancing.
But somewhere, not enough. Because 28,000 people a day are newly sick.
Trailing 5-day average:
Fri, 4/24: 27,930
Fri, 4/17: 28,511
We may be staying home.
We may be practicing social distancing.
But somewhere, not enough. Because 28,000 people a day are newly sick.
12/ So what's going on?
Some big states, which have lots of cases, have hit a plateau that looks like a miniature of the national one:
CA
MA
NJ
PA
TX
Cases dropped, but aren't dropping anymore.
Some big states, which have lots of cases, have hit a plateau that looks like a miniature of the national one:
CA
MA
NJ
PA
TX
Cases dropped, but aren't dropping anymore.
13/ If your state is on that list, no one should be talking about re-opening. The virus is making its way around as it is, very effectively.
New York has seen new cases rise 3 days in a row. The increase is a couple thousand, day over day. 3 days isn't a trend, but a warning.
New York has seen new cases rise 3 days in a row. The increase is a couple thousand, day over day. 3 days isn't a trend, but a warning.
14/ Some states with fewer cases are nonetheless also not seeing cases fall:
AZ
CO
IN
MI
MN
MS
NV
NC
These places add 50 to 200 cases a day — small compared to states adding 1,500 cases a day. But that level is persistent.
That virus isn't under control. It's waiting.
AZ
CO
IN
MI
MN
MS
NV
NC
These places add 50 to 200 cases a day — small compared to states adding 1,500 cases a day. But that level is persistent.
That virus isn't under control. It's waiting.
15/ Could Arizona or Minnesota become like New York?
No. But the Phoenix metro area has 5 million people. The Twin Cities have 3 million. Those places could have sustained, ugly outbreaks.
No. But the Phoenix metro area has 5 million people. The Twin Cities have 3 million. Those places could have sustained, ugly outbreaks.
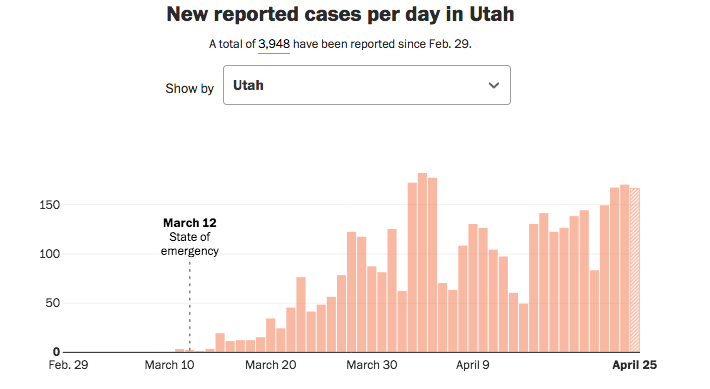
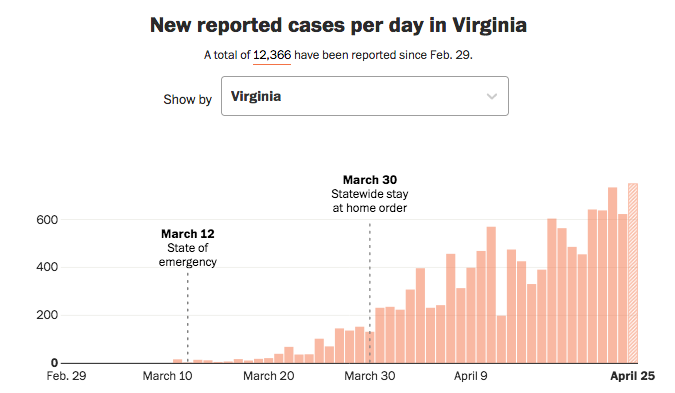
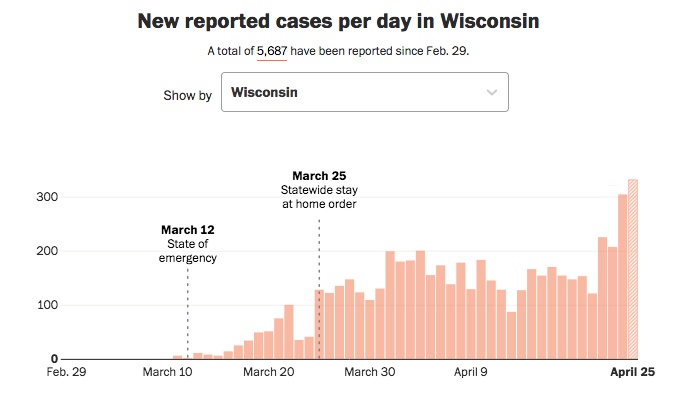
16/ And also on the watch-list should be four states with a small number of cases where the new cases are rising steadily, day over day, or on a higher plateau than 2 weeks ago — a month into stay-at-home:
SC
UT
VA
WI
Utah, Virginia & Wisconsin are going the wrong way.
SC
UT
VA
WI
Utah, Virginia & Wisconsin are going the wrong way.
17/ Graphs, from the data wizards @washingtonpost — for those three states below.
Check your own trends here:
washingtonpost.com/graphics/2020/…
Check your own trends here:
washingtonpost.com/graphics/2020/…
18/ The national number of new cases isn't dropping because in some important states, cases have plateaued, and in a small number of states, cases are increasing.
Remember: If we stay at home, there shouldn't be an increase in cases over time.
Those states should be asking why.
Remember: If we stay at home, there shouldn't be an increase in cases over time.
Those states should be asking why.
19/ Now test data.
• New tests performed Fri, April 24, 2020: 223,552
* Third big day of testing in a row *
• Change from previous day: + 32,497
• 5-day trailing average of new tests performed: 203,531
• Total US tests performed as of April 18: 4,883,802
• New tests performed Fri, April 24, 2020: 223,552
* Third big day of testing in a row *
• Change from previous day: + 32,497
• 5-day trailing average of new tests performed: 203,531
• Total US tests performed as of April 18: 4,883,802
20/ Testing is growing. A real bright spot.
The last 2 days (Thu, Fri) have seen the highest daily totals that didn't happen because of a spike in reporting.
Went through every state's test data each of the last 3 days.
Thu & Fri represent real organic growth in testing.
The last 2 days (Thu, Fri) have seen the highest daily totals that didn't happen because of a spike in reporting.
Went through every state's test data each of the last 3 days.
Thu & Fri represent real organic growth in testing.
21/ What does that mean?
If you look back at a state's test data, what do the trends look like?
FL: 20,000 tests a day, 2x their recent average
GA: 6,000 tests a day, 2x recent average
IL: 16,000 tests a day, 2x recent average
NM: 5,000 tests a day, 2x recent average
If you look back at a state's test data, what do the trends look like?
FL: 20,000 tests a day, 2x their recent average
GA: 6,000 tests a day, 2x recent average
IL: 16,000 tests a day, 2x recent average
NM: 5,000 tests a day, 2x recent average
22/ The daily increment from just those four states comes to 23,000 additional tests a day being done.
If the whole country has only been doing 150,000 a day, adding 23,000 a day — permanently, at a new level — is a good increase in capacity.
If the whole country has only been doing 150,000 a day, adding 23,000 a day — permanently, at a new level — is a good increase in capacity.
23/ Also Friday:
New York state recorded its biggest test day ever — 34,000 tests in 1 day, part of a trend where New York is doing 10,000 more tests a day than its recent average.
Texas recorded its biggest test day ever — 17,000 tests Friday, 8,000 above its recent average.
New York state recorded its biggest test day ever — 34,000 tests in 1 day, part of a trend where New York is doing 10,000 more tests a day than its recent average.
Texas recorded its biggest test day ever — 17,000 tests Friday, 8,000 above its recent average.
24/ NY & TX — if trend holds — are adding another 18,000 new tests than typical per day.
Those 6 states are doing 41,000 more tests a day — recently — than they had been.
That's how you get from 150,000 tests a day to 200,000.
Several other states trending up less sharply.
Those 6 states are doing 41,000 more tests a day — recently — than they had been.
That's how you get from 150,000 tests a day to 200,000.
Several other states trending up less sharply.
25/ Reminder: 200,000 tests a day is not nearly enough. It's just the next step up from 150,000 tests a day.
The US needs 1 million to 5 million tests a day, depending on how testing is being used.
Testing is just now starting to catch up with the pace at which cases spread.
The US needs 1 million to 5 million tests a day, depending on how testing is being used.
Testing is just now starting to catch up with the pace at which cases spread.
26/ Finally, let's benchmark Georgia — as Georgia is in the spotlight for starting to open businesses & its economy.
Today, we'll just look at where Georgia stood as of Friday, April 24.
We won't know how the Georgia experiment works for somewhere between 1 week and 4 weeks.
Today, we'll just look at where Georgia stood as of Friday, April 24.
We won't know how the Georgia experiment works for somewhere between 1 week and 4 weeks.
27/ Georgia has a population of 10.6 million people.
• Total covid-19 deaths in Georgia, through Apr 24: 904
• Deaths in the last 7 days: 231 (26% of total)
• Deaths per 100,000 residents: 9
• Rank in death rate of 50 states + DC: 16th
(Deaths trend below.)
• Total covid-19 deaths in Georgia, through Apr 24: 904
• Deaths in the last 7 days: 231 (26% of total)
• Deaths per 100,000 residents: 9
• Rank in death rate of 50 states + DC: 16th
(Deaths trend below.)

28/ One thing to note about deaths in Georgia:
Except for a big spike on April 20, they have plateaued & started to trend down.
Deaths won't be an indicator of the safety of re-opening for many weeks, of course.
Coronavirus has a 7 to 14 day incubation period — to become ill.
Except for a big spike on April 20, they have plateaued & started to trend down.
Deaths won't be an indicator of the safety of re-opening for many weeks, of course.
Coronavirus has a 7 to 14 day incubation period — to become ill.
29/ Now, Georgia cases:
• Total covid-19 cases in Georgia, through Apr 24: 22,695
• Days in a row of falling cases: 0
• 5-day trailing average, new cases added:
--> Fri, 4/24: 867
--> Fri, 4/17: 976
--> Fri, 4/10: 1,023
• Total covid-19 cases in Georgia, through Apr 24: 22,695
• Days in a row of falling cases: 0
• 5-day trailing average, new cases added:
--> Fri, 4/24: 867
--> Fri, 4/17: 976
--> Fri, 4/10: 1,023
30/ Georgia has not started a significant, measurable downward trend in new cases.
On Fri, Apr 24, the day it started to allow people to go back to some workplaces, & to bring in customers, Georgia reported 979 new cases.
On Fri, Apr 24, the day it started to allow people to go back to some workplaces, & to bring in customers, Georgia reported 979 new cases.
31/ New cases Friday at 979 is slightly above the 5-day average for that day — cases rose.
And 979 new cases is above the 5-day average for 1 week ago, and not significantly different than the 5-day average for 2 weeks ago.
Graph of new cases below.
And 979 new cases is above the 5-day average for 1 week ago, and not significantly different than the 5-day average for 2 weeks ago.
Graph of new cases below.

32/ That is not a graph that shows steadily declining cases. And Georgia isn't at a plateau of adding 50 or 100 cases a day statewide.
It's adding 750 to 1,000 on average. As the graph shows, the reporting is a little bumpy.
The epidemiologists said: 14 days of falling cases.
It's adding 750 to 1,000 on average. As the graph shows, the reporting is a little bumpy.
The epidemiologists said: 14 days of falling cases.
33/ The White House said: 14 days of falling cases.
Is Georgia ready to start having starngers interact?
Is the coronavirus under control — not likely to catch fire again?
Skepticism is warranted.
But that's the experiment.
Is Georgia ready to start having starngers interact?
Is the coronavirus under control — not likely to catch fire again?
Skepticism is warranted.
But that's the experiment.
34/ It would be nice to see the spread of the virus whither as Georgia slowly re-opens to certain kinds of work life and recreation.
That would be confounding in the best way.
We'll watch Georgia. Update in next Saturday's thread.
#
That would be confounding in the best way.
We'll watch Georgia. Update in next Saturday's thread.
#

