
Another thing to consider when you are creating your data visualizations is to try not to rely on the same graphs over and over and over again. DataViz is a mix of science and design, so be creative! 

Here are a few I present in the #ElevateTheDebate book.
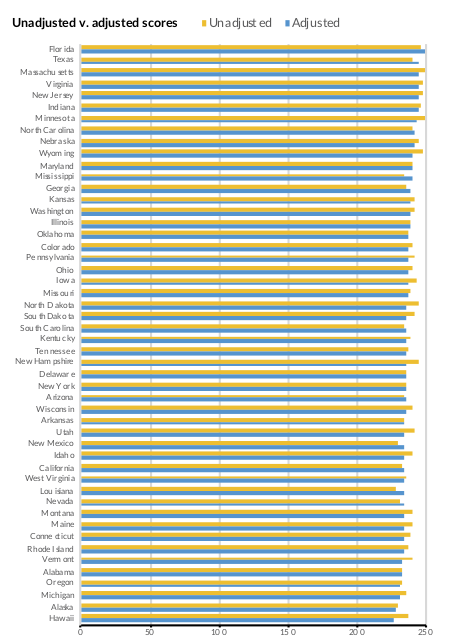
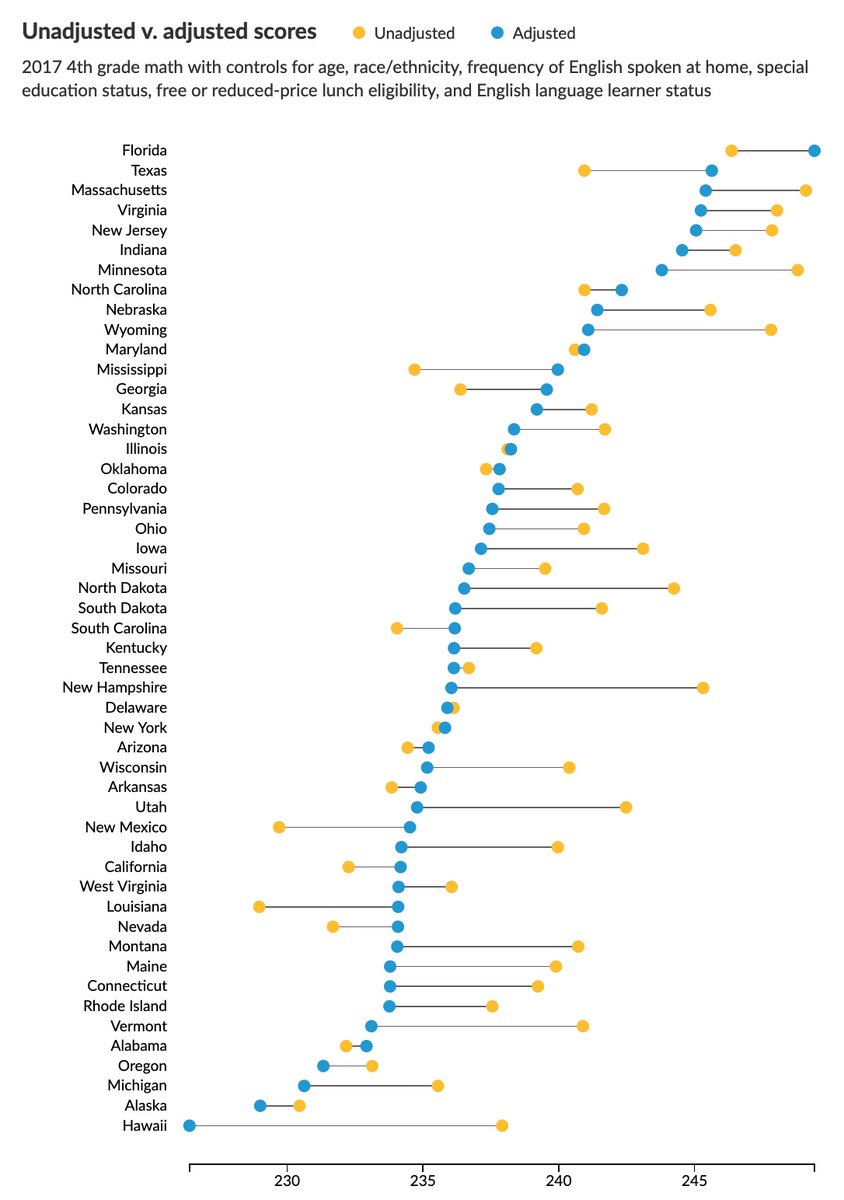
-First, the dot plot is a good alternative to bars because it enables the reader to see both the level and the change. This example uses data from the National Assessment of Educational Progress for 20 states in 2017.
-First, the dot plot is a good alternative to bars because it enables the reader to see both the level and the change. This example uses data from the National Assessment of Educational Progress for 20 states in 2017.
Second, heat maps use ranges of colors or shades to represent differences in values. This heat map shows auto fatalities over the course of the year, laid out like a calendar. It's pretty easy to see that there are more fatalities on the weekends.

The default/basic approach might be to create a line chart, like I've done here. Even when I add dots to Saturdays, it's really hard to tell that basic story.
So, even though the heatmap may be a "nonstandard" graph, in this case, it's easier to see the most important patterns.
So, even though the heatmap may be a "nonstandard" graph, in this case, it's easier to see the most important patterns.

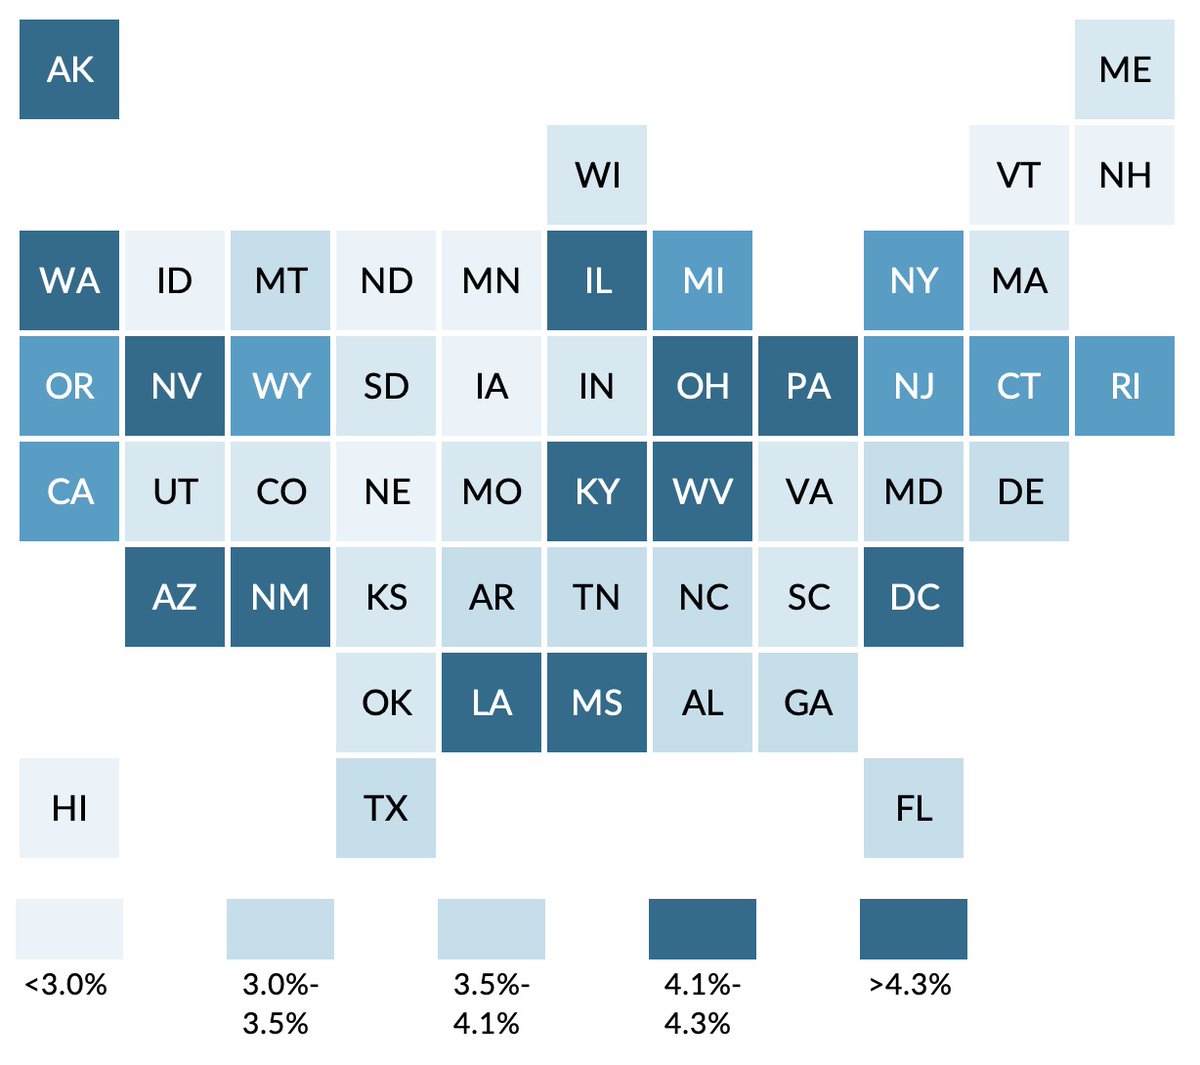
One last example. Maps. Specifically, a tile grid map assigns an equally sized shape (such as squares or hexagons) to each geographic unit, regardless of its size. Same data, two different maps here.

If you want to learn more about maps, I highly recommend the book Cartography by @kennethfield. His blog is also awesome. | amzn.to/2W7iQK0
Okay, I lied. One final example. Waffle charts--a set of aligned squares, typically divided into a 10x10 grid to visualize percentages or part-to-whole relationships.

There are lots of resources, libraries, and "chart choosers" out there that you can use as a reference. There is no answer to the question of what's the "right" chart, but these tools can be useful to help get your creative juices flowing.
Some examples:
-My "Graphic Continuum": policyviz.com/product/the-gr…
-The Visual Vocabulary from @FT: ft-interactive.github.io/visual-vocabul…
-The Data Visualisation Catalogue: datavizcatalogue.com
-The R Graph Gallery: r-graph-gallery.com
-My "Graphic Continuum": policyviz.com/product/the-gr…
-The Visual Vocabulary from @FT: ft-interactive.github.io/visual-vocabul…
-The Data Visualisation Catalogue: datavizcatalogue.com
-The R Graph Gallery: r-graph-gallery.com


