Asbjørn Støylen 🇳🇴🇩🇰 Profile picture
May 6, 2020 14 tweets 5 min read Read on X
#Cardiotwitter. Continuing the series on time intervals, I’ll now use some time on the ejection period. It’s not as simple as it may seem at first glance, and there is a lot going on. Image
1/ Comparing a tension length diagram of an isotonic/isometric twitch, and a pressure/volume (Wiggers)diagram. I've added the division of pre ejection into protosystole and IVC from previous threads. Image
2/ The ejection period is not isotonic, as pressure increases and then decreases, and the myocardial tension must follow a similar course. Thus the tension increase is only during the first part of ejection, and then tension decline so last part of ejection is relaxation
3/ With conventional pressure/flow recordings, the peak pressure / tension is around mid ejection, but looking at flow, peak flow through aortic ostium is much earlier. Peak flow must mean peak rate of volume decrease, and occurs early during ejection. Image
4/ Flow velocity (m/s) is a nice proxy for flow (l/min), as long ar the postal area is constant., and peak flow velocity is likewise an early event during ejection. Image
5/ Annular velocity is the peak rate of shortening, which again is a proxy for the rate of volume decrease. Peak annular velocity is likewise an early event during ejection, and peak flow and peak shortening velocity are closely related. Image
Image
6/ As we see, annular velocity is equivalent to the inverse of strain rate of the wall ncbi.nlm.nih.gov/pubmed/32154940,
annular displacement is equivalent to the inverse of strain ncbi.nlm.nih.gov/pubmed/29399886, so all of these are related Image
7/ And, there is a nice correspondence between volume curve and strain curve, fiber shortening corresponds to volume reduction, so SV/EF and GLS are closely related. Image
8/ We know that both SV and EF, and thus MAPSE and GLS are afterload dependent, shortening is tension vs load. Image
9/ The rate of tension development during isovolumic shortening is not afterload dependent, as discussed before. But the rate of shortening (which occurs during ejection) is afterload dependent, so the peak velocities will be as well. Image
10/ Peak flow/velocity/shortening rate is thus earlier than peak tension/pressure, possibly due to pressure (load) increase during early ejection; thus, peak velocity is a function not only of contraction velocity, but of timing of the peak. Image
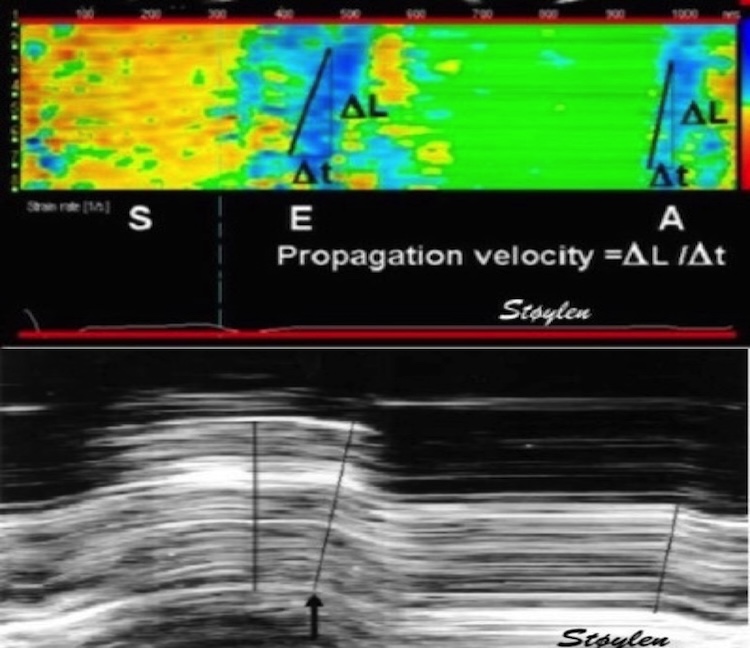
11/ Timing of peak is thus afterload dependent by the increase in ejection pressure, which is a function of not only resistance, but also of aortic stiffness, which again is of both compliance, and pressure augmentation index (pulse propagation velocity). Image

• • •

Missing some Tweet in this thread? You can try to force a refresh
 

Keep Current with Asbjørn Støylen 🇳🇴🇩🇰

Asbjørn Støylen 🇳🇴🇩🇰 Profile picture

Stay in touch and get notified when new unrolls are available from this author!

Read all threads

This Thread may be Removed Anytime!

PDF

Twitter may remove this content at anytime! Save it as PDF for later use!

Try unrolling a thread yourself!

how to unroll video
  1. Follow @ThreadReaderApp to mention us!

  2. From a Twitter thread mention us with a keyword "unroll"
@threadreaderapp unroll

Practice here first or read more on our help page!

More from @strain_rate

Apr 14
🧵 on atrial systole. 1/ Already in 2001, did we show that both the early and late filling phase was sequential deformation propagating from the base to the apex. pubmed.ncbi.nlm.nih.gov/11287889/
Image
2/ This means, both phases consist of a wall elongation wave, generating an AV-plane motion away from the apex. So what are the differences? Image
3/ Only e’ correlates with MAPSE, so the elastic recoil is finished in early systole, while a’ do not, so atrial systole is a new event, caused by the next atrial contraction. pubmed.ncbi.nlm.nih.gov/37395325/
Read 12 tweets
Apr 10
🧵1/ Sorry, I accidentally deleted the first tweet in this thread, here is a new and slightly improved version. Looking at the physiology of AVC propagation velocity, there are confounders galore, so taking it as a marker of fibrosis, is premature, to put it mildly.
2/ Firstly, The AVC is an event of onset of IVR, i.e at a part of heart cycle with relatively high cavitary and myocardial pressure. This may contribute to wall stiffness, which again may affect (probably increase) wave propagation velocity. Image
3/ Secondly, This may affect AS patients; who may have a higher wall/cavity pressure at end systole than controls, and thus higher pressure related stiffness.
Read 11 tweets
Apr 10
🧵1/ Looking at the physiology of AVC propagation velocity, there are confounders galore, so taking it as a marker of fibrosis, is premature, to put it mildly.
2/ Firstly, The AVC is an event of onset of IVR, i.e at a part of heart cycle with relatively high cavitary and myocardial pressure. This may contribute to wall stiffness, which again may affect wave prpagation velocity.
3/ Secondly, AS patients may have a higher wall/cavity pressure at end systole than controls, and thus higher pressure related stiffness.
Read 7 tweets
Apr 4
🧵 On early diastole. 1/ It is important to differentiate relaxation and myocyte elongation. Relaxation means tension devolution, due to the removal of Ca, and dissolution of actin/myosin cross bridges. Elongation means volume expansion. They are not simultaneous. Image
2/ Myoccyte relaxation actually starts during ejection at the time of peak pressure, the decreasing pressure during ejection shows decreasing myocyte tension. pubmed.ncbi.nlm.nih.gov/6227428/
3/ Simultaneously, ejection continues, chiefly due to inertia, until overcome by the Ao-LV pressure gradient, when AV closes. Thus, there is simultaneous myocyte relaxation (tension↓) and volume ↓ (= myocyte shortening). Here is blood flow / myocardial deformation interaction
Read 17 tweets
Mar 25
🧵1/ The E/A fusion in mitral flow with higher HR is well known, normally occurring around HR 100. Image
2/ also, it should be well known that this occurs because the diastole shortens more with high HR than systole. But why?
3/ In an early study of intervals during exercise, we showed that the RR-interval and DFP, but not LVET shortened in parallel < HR 100. > HR 100 (< RR 600) Both LVET, DFP and RR interval shortened in paralell, but at a slower rate. pubmed.ncbi.nlm.nih.gov/14611824/

Image
Image
Read 8 tweets
Jan 19
🧵 As for MAPSE, we showed in HUNT3 thatpwTDI S' varies between mitral ring sites. LV global S' must be averaged, but we have shown that the difference between mean of septal/lateral and of septal/anterior/lateral/inferior is negligible. Image
2/ Values are age dependent, and in fact mean of 2 walls was 8.37 cm/s, and of four walls 8.4 cm/s, the difference was statistically significant, but totally un interesting as lower measurement limit of pwTDI is 0.1 cm/s. folk.ntnu.no/stoylen/strain…
Image
3/ But what about diastolic velocities? variation of e' between sites is present as for S', as shown previously in HUNT3. It is common to average lateral/septal, but I haven't found any comparisons between two and four sites, so I looked at that in HUNT3 and found: Image
Read 8 tweets

Did Thread Reader help you today?

Support us! We are indie developers!


This site is made by just two indie developers on a laptop doing marketing, support and development! Read more about the story.

Become a Premium Member ($3/month or $30/year) and get exclusive features!

Become Premium

Don't want to be a Premium member but still want to support us?

Make a small donation by buying us coffee ($5) or help with server cost ($10)

Donate via Paypal

Or Donate anonymously using crypto!

Ethereum

0xfe58350B80634f60Fa6Dc149a72b4DFbc17D341E copy

Bitcoin

3ATGMxNzCUFzxpMCHL5sWSt4DVtS8UqXpi copy

Thank you for your support!

Follow Us!

:(