Asbjørn Støylen 🇳🇴🇩🇰 Profile picture
Cardiovascular physiology. Echocardiography, myocardial mechanics/deformation img. Environment.
Pedro Graziano Sanchez Profile picture Simone Ferreira Leite Profile picture Dr.MarcusLarrea Profile picture Juan Jose Rousseau Profile picture 4 subscribed
Apr 18 13 tweets 5 min read
Old misconceptions become as new. A 🧵 A recent paper focusses on pre ejection velocities as a contractility measure. In addition, the authors maintain that these velocities are isovolumic contraction, which they also maintain, is load independent. pubmed.ncbi.nlm.nih.gov/37816446/ All three concepts are wrong. True, the peak contraction velocity (peak rate of force development) occurs before AVO, and thus is afterload independent. But it's not preload independent and thus not a true contractility measure. pubmed.ncbi.nlm.nih.gov/13915199/
Image
Apr 14 12 tweets 4 min read
🧵 on atrial systole. 1/ Already in 2001, did we show that both the early and late filling phase was sequential deformation propagating from the base to the apex. pubmed.ncbi.nlm.nih.gov/11287889/
Image 2/ This means, both phases consist of a wall elongation wave, generating an AV-plane motion away from the apex. So what are the differences? Image
Apr 10 11 tweets 4 min read
🧵1/ Sorry, I accidentally deleted the first tweet in this thread, here is a new and slightly improved version. Looking at the physiology of AVC propagation velocity, there are confounders galore, so taking it as a marker of fibrosis, is premature, to put it mildly. 2/ Firstly, The AVC is an event of onset of IVR, i.e at a part of heart cycle with relatively high cavitary and myocardial pressure. This may contribute to wall stiffness, which again may affect (probably increase) wave propagation velocity. Image
Apr 10 7 tweets 2 min read
🧵1/ Looking at the physiology of AVC propagation velocity, there are confounders galore, so taking it as a marker of fibrosis, is premature, to put it mildly. 2/ Firstly, The AVC is an event of onset of IVR, i.e at a part of heart cycle with relatively high cavitary and myocardial pressure. This may contribute to wall stiffness, which again may affect wave prpagation velocity.
Apr 4 17 tweets 7 min read
🧵 On early diastole. 1/ It is important to differentiate relaxation and myocyte elongation. Relaxation means tension devolution, due to the removal of Ca, and dissolution of actin/myosin cross bridges. Elongation means volume expansion. They are not simultaneous. Image 2/ Myoccyte relaxation actually starts during ejection at the time of peak pressure, the decreasing pressure during ejection shows decreasing myocyte tension. pubmed.ncbi.nlm.nih.gov/6227428/
Mar 25 8 tweets 3 min read
🧵1/ The E/A fusion in mitral flow with higher HR is well known, normally occurring around HR 100. Image 
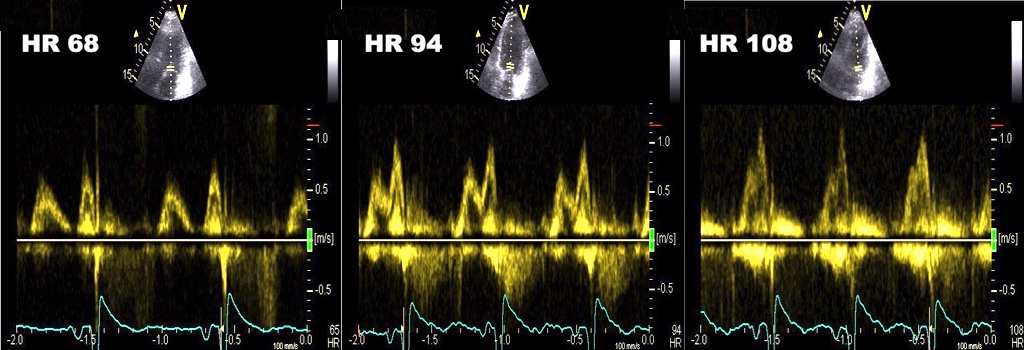
2/ also, it should be well known that this occurs because the diastole shortens more with high HR than systole. But why?
Jan 19 8 tweets 3 min read
🧵 As for MAPSE, we showed in HUNT3 thatpwTDI S' varies between mitral ring sites. LV global S' must be averaged, but we have shown that the difference between mean of septal/lateral and of septal/anterior/lateral/inferior is negligible. Image 2/ Values are age dependent, and in fact mean of 2 walls was 8.37 cm/s, and of four walls 8.4 cm/s, the difference was statistically significant, but totally un interesting as lower measurement limit of pwTDI is 0.1 cm/s. folk.ntnu.no/stoylen/strain…
Image
Jan 4 20 tweets 6 min read
🧵Having posted an erroneous thread on tissue Doppler in HUNT 3 vs 4, I’d like to explain the error. It arose from my comparing the spectral Doppler values from HUNT3 and colour Doppler from HUNT4. I’d like to expand on the S’, as well as the differences between the two methods. 1/ PW Doppler is analysed for the full frequency content (spectrum) of the signal. The real Doppler signal contains many frequencies, with various amplitudes, clean flow or tissue signals can be obtained by various filtering. Image
Dec 8, 2023 10 tweets 4 min read
🧵So you think MAPSE is easy? Think again! The discrepancy between the measured LV shortening in HUNT3 (2006 – 2008) and HUNT 4 (2017 – 2019) has cast new light on the methodology of MAPSE. The two cohorts are similar in numbers, sex proportions, age distribution, BMI and BT. 1/ HUNT3 measured MAPSE by longitudinal M-mode of the mitral ring, finding mean 1.6 cm. Little difference between only 4-ch, 2- and 4 ch and 2-, 3- and 4ch.

pubmed.ncbi.nlm.nih.gov/29399886/
Image
Nov 23, 2023 17 tweets 6 min read
🧵 1/ HUNT3 and 4, two of the largest normal single center studies of #EchoFirst in the world. HUNT3 1266 vs HUNT4 1412, mean age 49.1, vs 61.1 years (many measures are age related), both normally distributed. 52.3% vs 55.8% women. pubmed.ncbi.nlm.nih.gov/36881415/ 2/ Thy differ in measurement methodology, meaning that comparison is interesting from a methodological viewpoint, but also in looking at age and sex relations across methods. In linear dimension measurements, HUNT 3 used mainly M-mode, HUNT4 B-mode. pubmed.ncbi.nlm.nih.gov/19946115/
Nov 10, 2023 12 tweets 4 min read
Strain and strain rate. Signed or numerical values? 🧵
1/ Strain was defined by Lagrange as (L-L0 / L0) or by Euler as (L-L0 / L). (Lagrangian strain is the customary measure. For discussion of the difference, see folk.ntnu.no/stoylen/strain… 2/ This means that Strain is defined in both the positive and negative domain, where positive strain is lengthening, and negative strain shortening, so the signed values carry slightly more information than the numerical values. Image
Nov 4, 2023 9 tweets 3 min read
🧵New reference values for longitudinal strain from the HUNT4 study, measured by 2D ST from one vendor, but comparing varieties of the proprietary analysis software with different automation (2DS vs AFI) shows small differences. sciencedirect.com/science/articl… 2/ Commendable, the authors have compared the 16 and 18 segment ASE models. The 18 segment model is over weighted in favour of the apex, compared to the real amount of myocardium, but the study shows a small, significant difference, but far less than the repetition coefficient.
Aug 6, 2023 10 tweets 4 min read
🧵Having previously tweeted about the LA strain during ejection ("reservoir strain") , This thread will be about the atrial strain during early filling ("conduit strain"). 2/ LA strain, is Mitral annular plane motion with atrial wall length as denominator. The "conduit strain" is the strain during early ventricular filling, and the main determinant is the reverse Mitral annular motion in early diastole. Image
Jul 15, 2023 12 tweets 4 min read
🧵1/ In our last publication from HUNT3, we did show that LV Global MAPSE, SV and EF all correlate, while GLS (by two methods), correlate with MAPSE and EF, but not with SV. This raises concern about the validity of strain based GMW. doi.org/10.1111/cpf.12… 2/ True global myocardial work (the area of the pressure volume loop) = SV X (mean ventricular SBP-DBP), is dependent on SV and BP, but not EF, as seen from the formula (thus, the work is the same for all EF given equal SV and BP). Image
Jul 11, 2023 11 tweets 3 min read
Our new paper from the HUNT3 study about #AV_plane motion is out. doi.org/10.1111/cpf.12… 🧵1/ Unsurprisingly, Global MAPSE S', SV and EF all correlated. GLS correlated with MAPSE, S' and EF, but surprisingly not with SV. As global myocardial work = SV X intraventricular(SBP-DBP), this raises concern about the validity of strain based GMW.
May 29, 2023 9 tweets 3 min read
🧵Left atrial strain. 1/ Left atrial strain is the deformation of the left atrium, measured throughout the heart cycle. There are three phases as recommended by present guidelines: LA reservoir strain, LA conduit strain and LA contractile strain as shown in the figure Image 2/ But what does these measures signify physiologically? Taking a look at the atrial and ventricular strain curves from the same ventricle is interesting. As we see, the two sets of curves are reciprocal. Image
Mar 23, 2023 10 tweets 3 min read
🧵 on GMW in IVR 1/We have, as many others, shown a simultaneous elongation in the apex as well as shortening in the base of the LV during IVR in healthy subjects. This is probably due to the apical "untwisting". pubmed.ncbi.nlm.nih.gov/34184410/ 2/ This can be readily shown by strain rate: During IVR, elongation in the apex (blue) is balanced by shortening in the base. The same can be seen in strain rate curves (bottom), elongation in the apex (positive SR), shortening in the base (negative SR) during IVR. Image
Feb 1, 2023 7 tweets 2 min read
🧵 on the geometry of SV, EF and MAPSE.
1: SV is proportional to MAPSE x outer LV area. pubmed.ncbi.nlm.nih.gov/17098822/ 2/ Left: cavity volume reduction, as function of cavity longitudinal and endocardial shortening. Right: total LV volume = cavity + myocardial volume. Given a minimally incompressible myocardium, ⬇️ in total volume = ⬇️ in cavity volume, as myocardial volume is constant.
Dec 16, 2022 10 tweets 4 min read
Oh well, back to basics. 🧵 1/ There are three major strain directions of the LV; Longitudinal, circumferential and transmural (radial). They do NOT relate to fibe directions, they are simply the coordinates of ONE three dimensional object, the LV myocardium. 2/ As the LV myocardium is mainly incompressible, it must mean that when the left ventricle shortens, so do the walls. As the walls thicken, they must shorten to conserve the myocardial volume.
Jan 30, 2022 11 tweets 4 min read
🧵 In our paper “Intraventricular Vector Flow Imaging with Blood Speckle Tracking in Adults: Feasibility, Normal Physiology and Mechanisms in Healthy Volunteers” pubmed.ncbi.nlm.nih.gov/34620522/ , quantitative measures can be extracted. In a previous thread, … I've tweeted about the relation between kinetic energy and vorticity. KE, of course peaks with peak velocity, but while velocity is positive or negative, depending on direction, KE is related to v square, and is thus only positive
Jan 26, 2022 19 tweets 6 min read
🧵In our paper “Intraventricular Vector Flow Imaging with Blood Speckle Tracking in Adults: Feasibility, Normal Physiology and Mechanisms in Healthy Volunteers” pubmed.ncbi.nlm.nih.gov/34620522/ , findings were not only qualitative as described in previous threads, but also quantitative. 1/ Measures of kinetic energy (KE), vorticity (VO), energy loss (EL) and pressure gradients (PG) can be calculated. The figure from the paper shows the curves from all subjects in the study. What does these measures mean, and are they likely to add useful information?