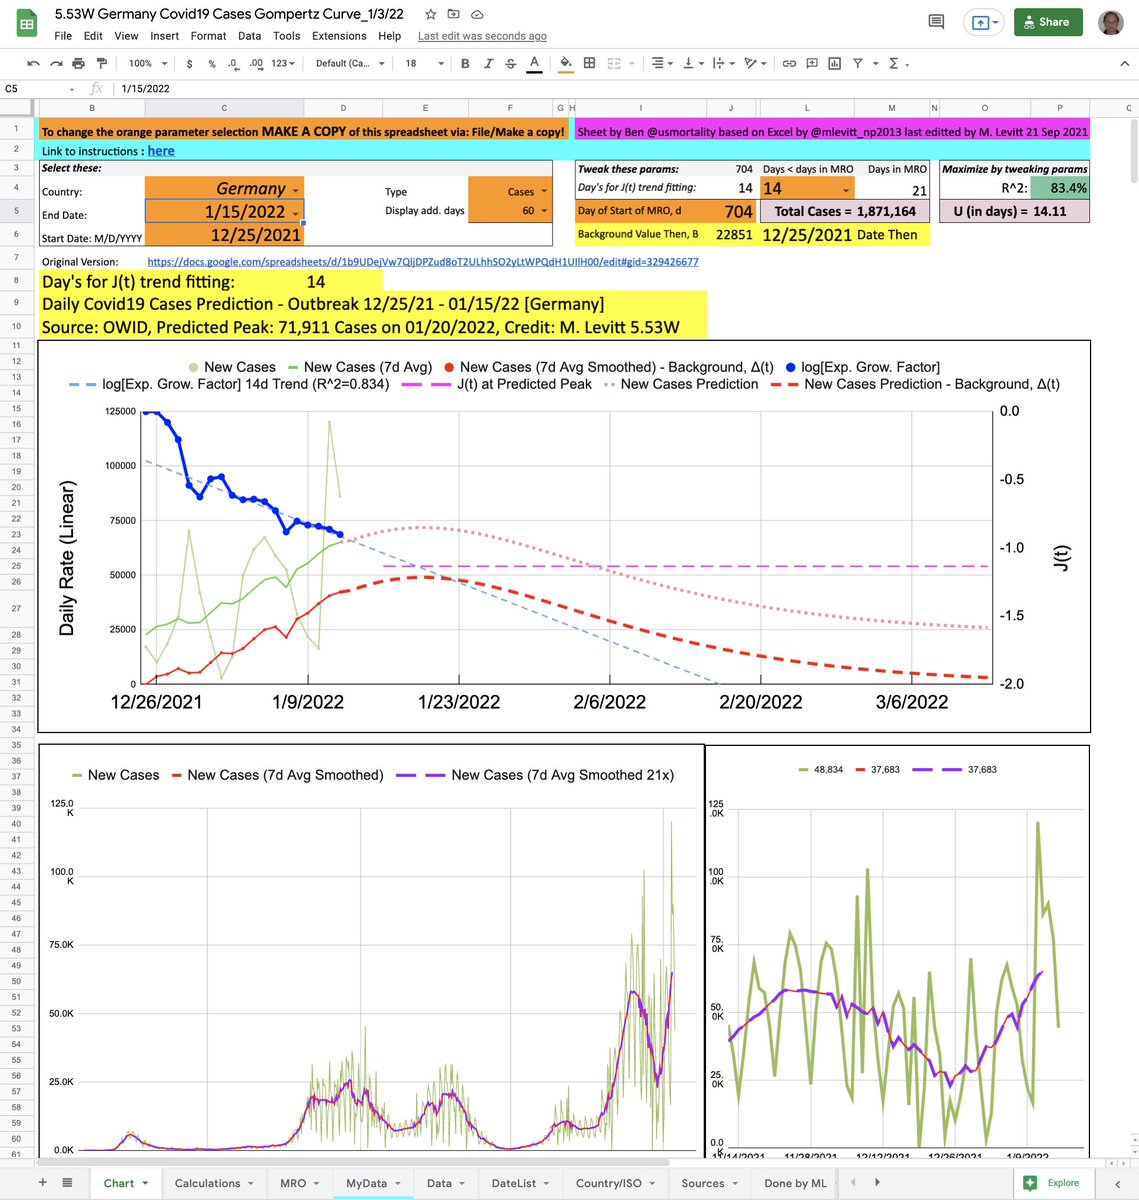
The app was written in Python by Andrea Scaiewicz advised by João Rodrigues. It is research software allowing comparison of all locations with >50 deaths or >3000 cases (see examples). Response is slow as freely hosted by heroku @heroku. Tested too little, it is likely buggy.
The table of locations is classified by Class score. Columns can be sorted or filtered by a string (eg. "====" with quotation selects worst locations). UNSM is raw data, SMO3 is moderate smoothing & SMO5 is more extreme smoothing.
Enjoy at levitt1.herokuapp.com and feed back to me. I intend to pay for better hosting as needed. Also please suggest alternative places we can host this.
• • •
Missing some Tweet in this thread? You can try to
force a refresh
As someone who broke the news to Israeli leaders on Sweden’s handling of COVID-19 in Mar. 2020, I am so distressed to be reading this now m.ynet.co.il/articles/hj30k…
When will Homo Sapiens realize that we can never stop a tiny virus & re-engineer human biology by force not smarts?
Please note that the two translation are automatic. I give independent results from Microsoft and Google. The original is in Hebrew.
Taking this opportunity to rejoice in machine translation. It it so worthwhile to get used to its quirks.
Fortunately age-adjusted excess death in Israel for the 75 weeks from 1-Jan-20 to 6-Jun-21 is almost as small as that in Sweden (<2% of natural death in 75 weeks)
Economic, social, medical & educational cost to Israel likely higher than to Sweden.
2/8 Rather than make plots of one measure against another, we get the correlation coefficient of all pairs of measures.
Correlation coefficient, CC, of A to B is same as CC of B to A so table is symmetric. Correlation coefficient of A to A is always 1; it is whited out here.
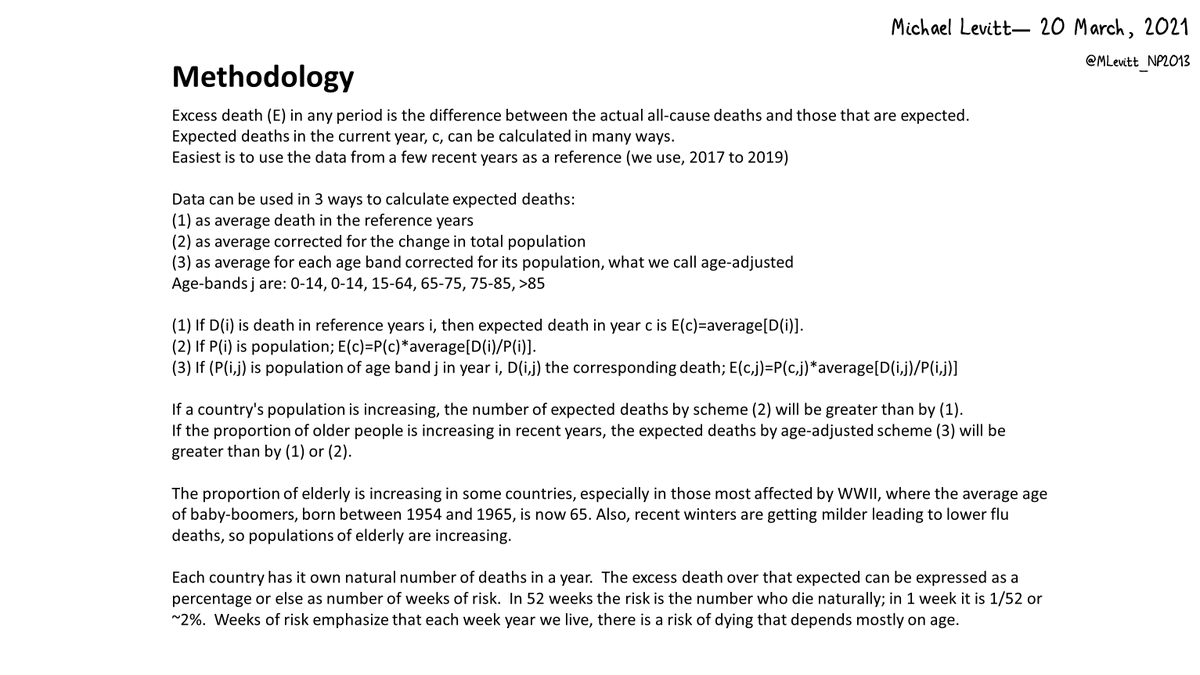
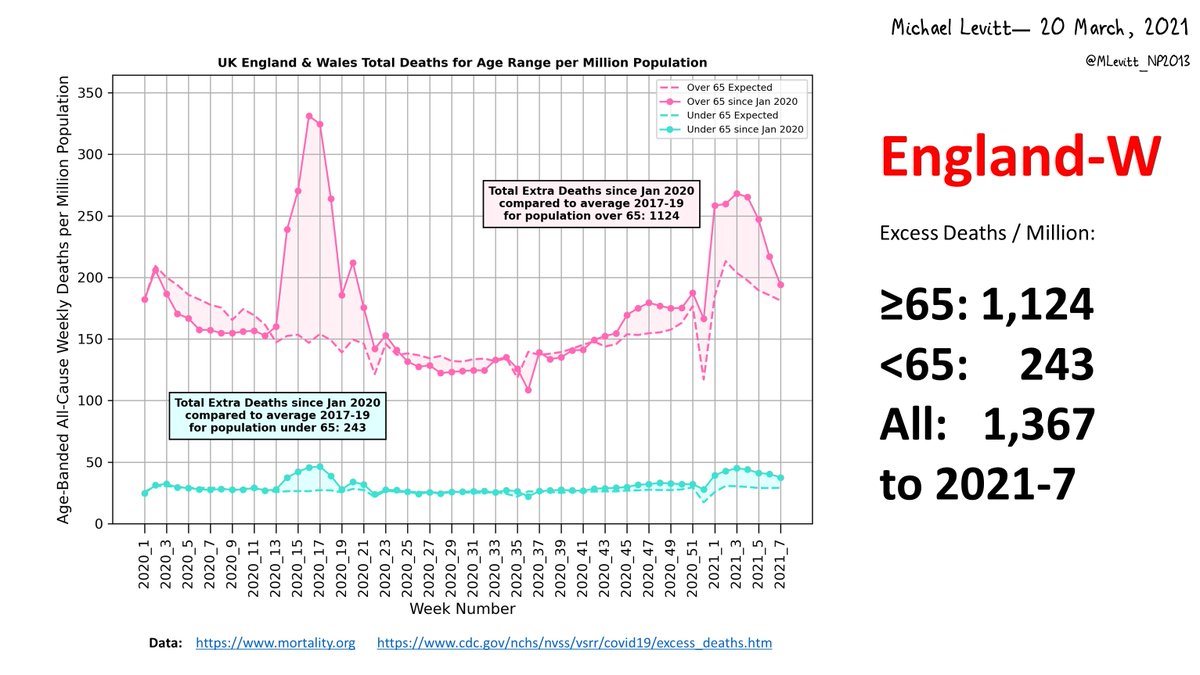
1/7 Excess death (E) in any period is the difference between the actual all-cause deaths and those that are expected. Expected deaths in the current year, c, can be calculated in many ways. Easiest is to use the data from a few recent years as a reference (we use, 2017 to 2019).
2/7 Data can be used in 3 ways to calculate expected deaths. (1) as average death in the reference years. (2) as average corrected for the change in total population. (3) as average for each age band corrected for its population, what we call age-adjusted.
We use 5 age bands.
3/7 (1) If D(i) is death in reference years i, then expected death in year c is E(c)=average[D(i)]. (2) If P(i) is population; E(c)=P(c)*average[D(i)/P(i)]. (3) If (P(i,j) is population of age band j in year i, D(i,j) the corresponding death; E(c,j)=P(c,j)*average[D(i,j)/P(i,j)]