link.springer.com/article/10.100…
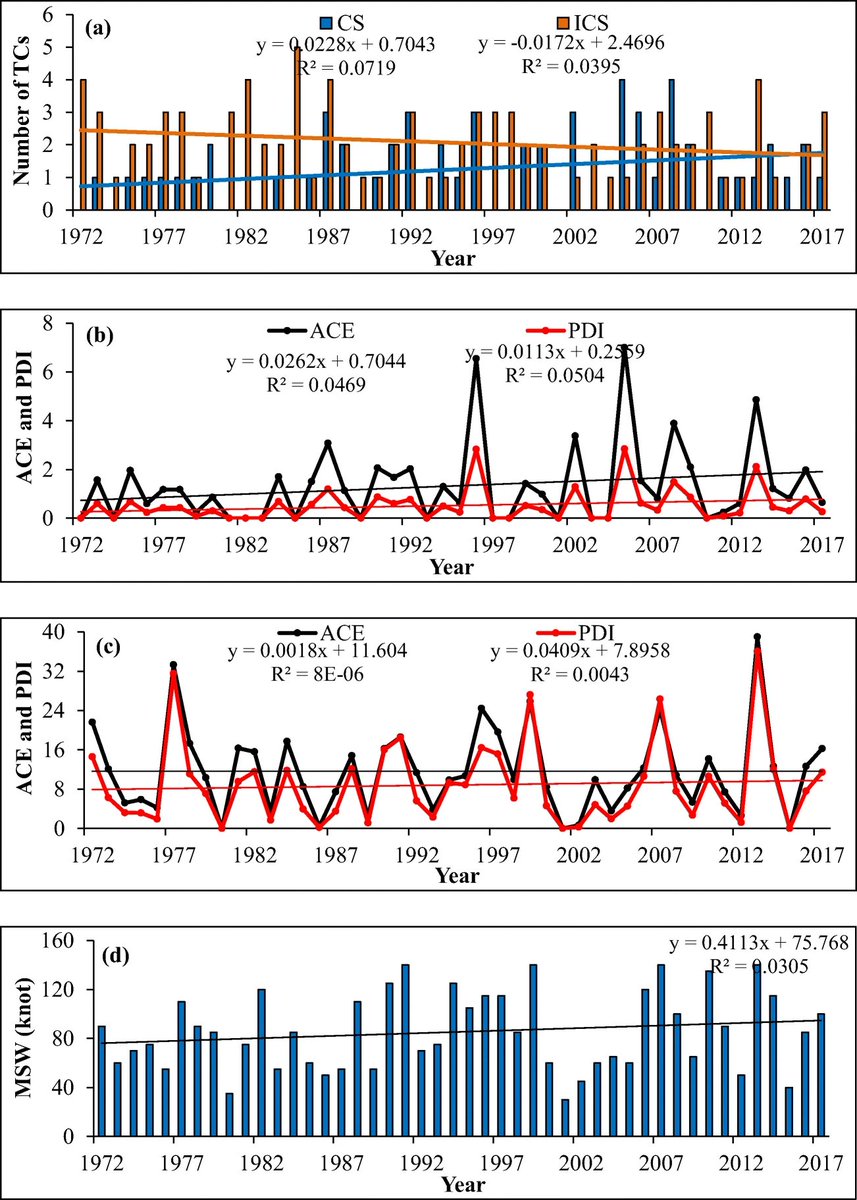
Fig10. Annual distribution of a CSs & ISCs, b & c shows the ACE & PDI values of CSs & ICSs, respectively, d shows the MSW speed in the BoB during the period 1972–2017

More weak storms
No significant trend in strong storms (or intensity)
link.springer.com/article/10.100…


Climate is highly variable
When you start & stop a trend analysis makes a big difference
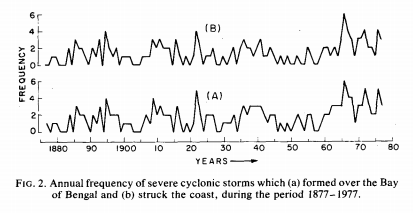
The mid-60s-mid-70s were super active in the BOB
So start there, and you get down trends to 2017
Here is BoB TC landfall data 1877-1977 from Mooley 1980
journals.ametsoc.org/doi/pdf/10.117…

Panel (a) is pre-satellite, Panel (b) is post-satellite
link.springer.com/article/10.100…


