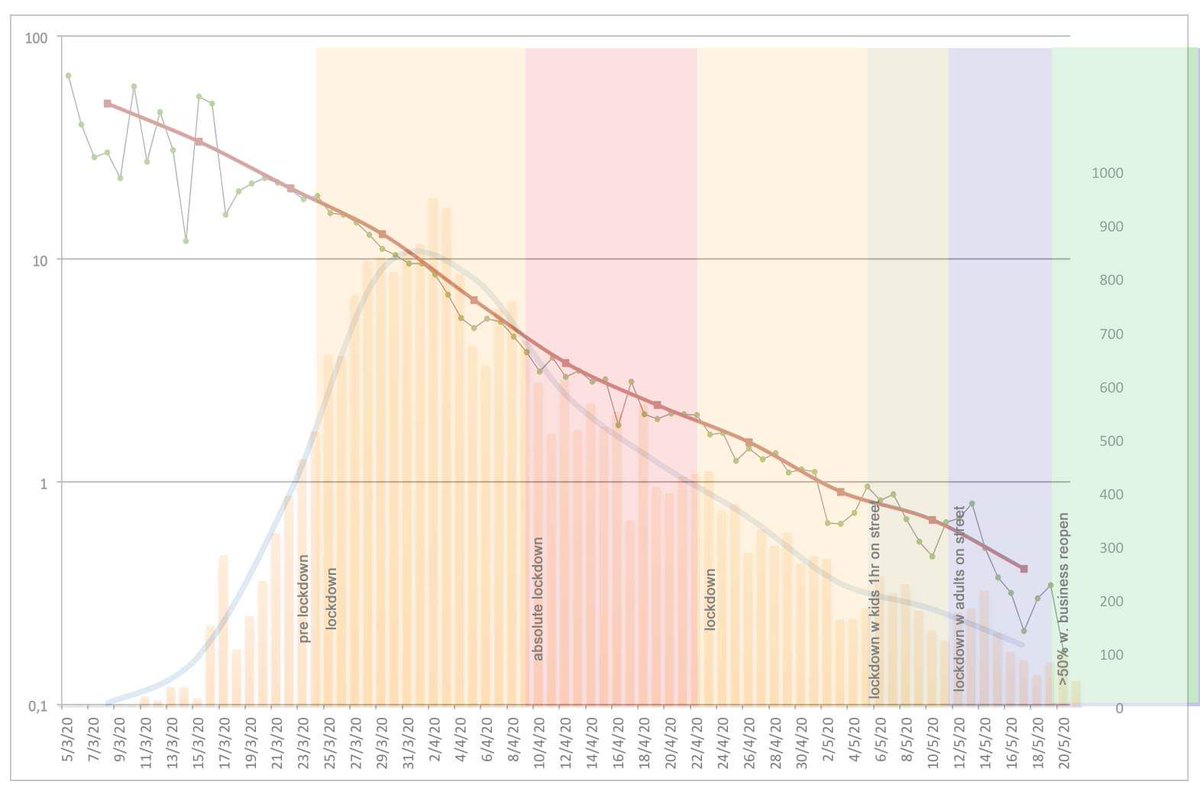
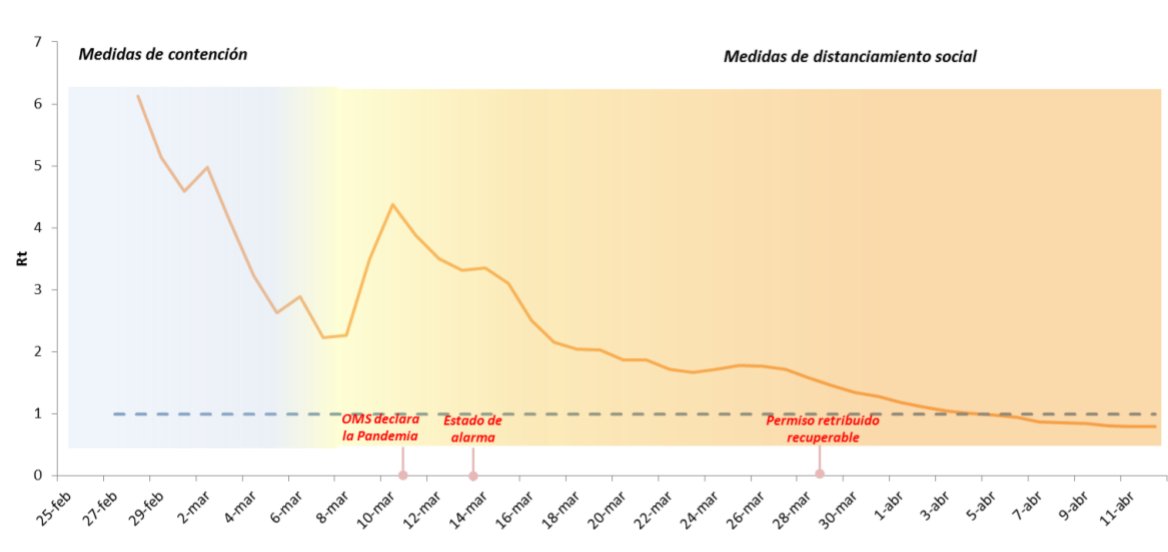
Green line is daily tendency, and suffers from notification anomalies.
Red line is the weekly average, as Spain's gov uses.
Bars are daily deads, and it's curve fitting points clearly Gompertz, as expected with tendency.
That inadequate relation between measures and tendency points to natural cluster causes more than restrictions.
You can see how NONCHALANT to lockdown curve remains!!
@MLevitt_NP2013

What in nature follows this pattern!!! Not related AT ALL neither with restrictions.
@daniellevitt22


