Wow this is a WILDLY misleading way to portray COVID mortality.
This conflates COVID with non-transmissible diseases, and equates mortality levels from limited COVID spread to mortality levels from transmissible disease that are more widely spread.
This conflates COVID with non-transmissible diseases, and equates mortality levels from limited COVID spread to mortality levels from transmissible disease that are more widely spread.
The clear message here is "hey, we don't shut down the country over unintentional injury or suicide, why should we for COVID?"
The fairly obvious reply is: if car accidents and suicides were exponentially transmissible, you bet your ass we'd shut down the country ASAP.
The fairly obvious reply is: if car accidents and suicides were exponentially transmissible, you bet your ass we'd shut down the country ASAP.
And incidentally, if you don't think the country also reacts massively to modest vehicle safety issues, you may want to revisit this episode, in which Toyota had to recall 9 million vehicles over 37 deaths: en.wikipedia.org/wiki/2009%E2%8…
The chart's treatment of communicable diseases is no better.
The fatality figures shown across age ranges for flu, for example, reflect a vastly higher level of transmission than COVID has achieved
Flu: 24m in 2015-16 and 29m in 2016-17
COVID: 1.5m reported (tho likely higher)
The fatality figures shown across age ranges for flu, for example, reflect a vastly higher level of transmission than COVID has achieved
Flu: 24m in 2015-16 and 29m in 2016-17
COVID: 1.5m reported (tho likely higher)
So the flu deaths are coming from a much higher degree of transmission - which is EXACTLY the outcome that distancing measures are trying to avert. With 24-29m COVID cases, COVID mortality would blow flu out of the water.
And of course, for flu we have a vaccine; not for COVID.
And of course, for flu we have a vaccine; not for COVID.
But there are more problems here!
These figures compare annual mortality totals to the mortality projections from only a few months' worth of COVID mortality (citing the IHME 150k deaths model).
These figures compare annual mortality totals to the mortality projections from only a few months' worth of COVID mortality (citing the IHME 150k deaths model).
And that in turn gets to the biggest sleight-of-hand in this chart.
In arguing that COVID is less lethal than other health risks, this chart presumes that the outbreak is fully contained by the time we reach 150k deaths, and things stop there.
In arguing that COVID is less lethal than other health risks, this chart presumes that the outbreak is fully contained by the time we reach 150k deaths, and things stop there.
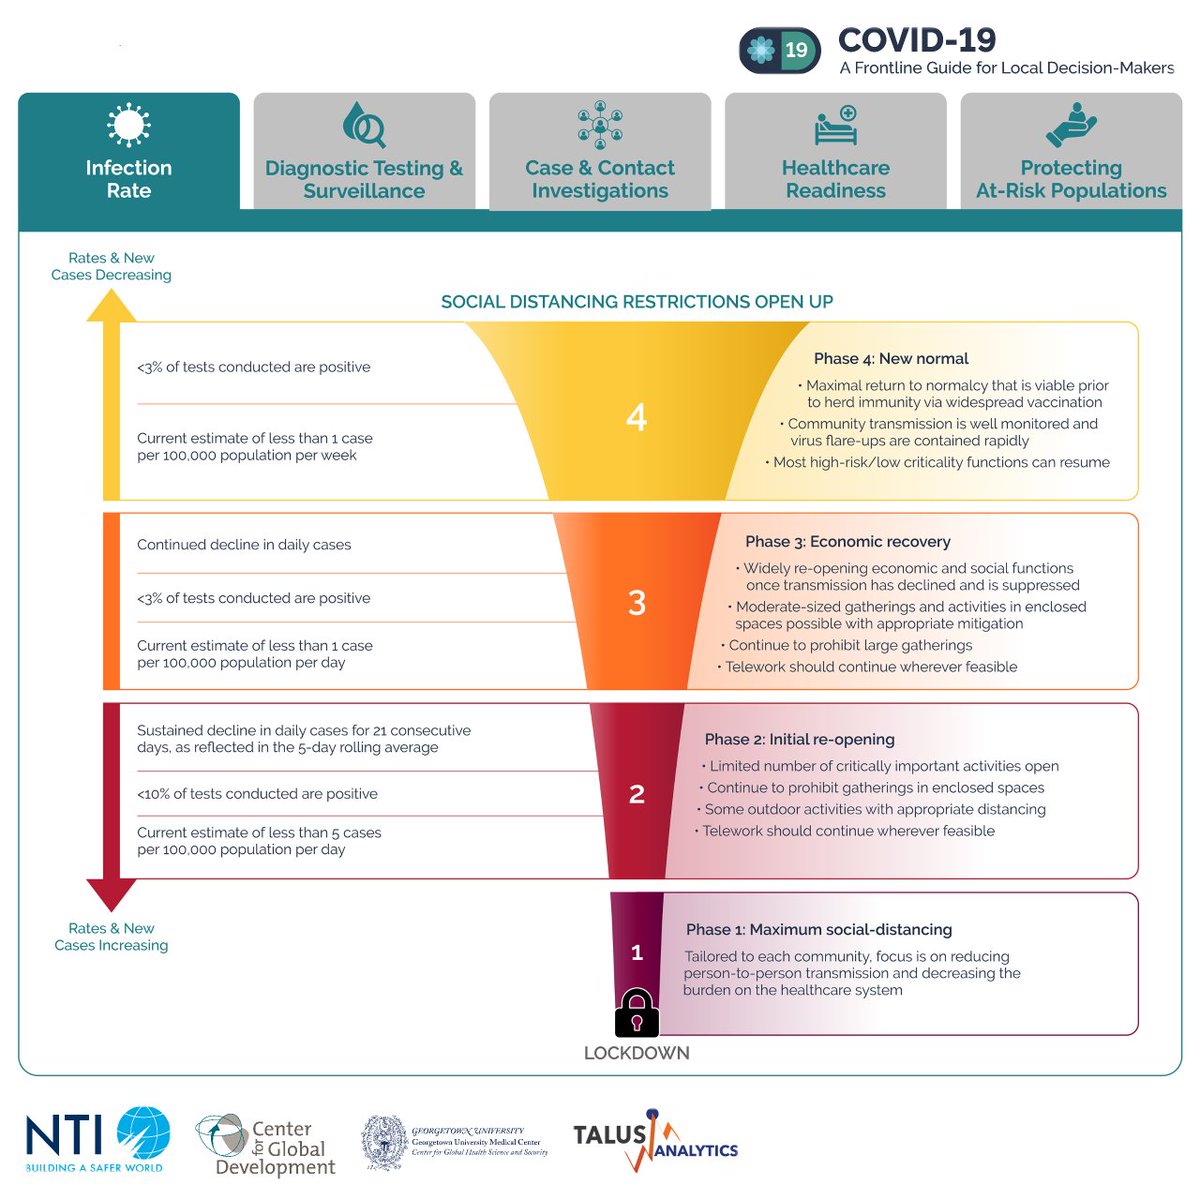
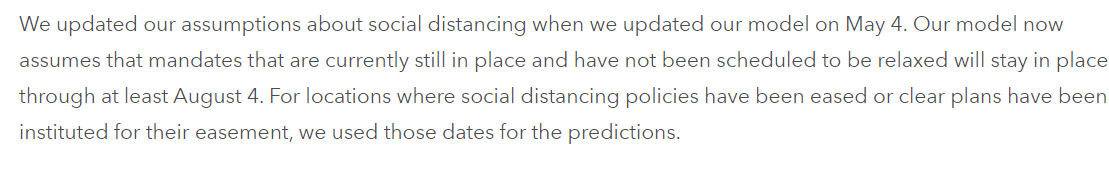
But of course, IHME's projections (whatever one thinks of them) are based on the presumption that distancing policies from early May remain in force until early August.
Which is pretty much exactly what @Avik is arguing *against*.
healthdata.org/covid/faqs
Which is pretty much exactly what @Avik is arguing *against*.
healthdata.org/covid/faqs
So the whole underlying premise of this chart - that COVID is a relatively minor health risk that shouldn't prompt drastic distancing - rests on a fatality model that presumes the exact opposite.
I don't know if that's a good faith error or a bad faith one, but...WOW.
I don't know if that's a good faith error or a bad faith one, but...WOW.
Basically Roy is arguing against distancing measures using a projected a death toll that is only possible through adherence to distancing measures.
The moment his advice is enacted his chart evaporates. It's literally nonsense.
The moment his advice is enacted his chart evaporates. It's literally nonsense.