
I had so much fun working on this data science course!
One aspect of the fun I had was learning interesting information about the data I used. I share my learnings here and look forward to hearing about yours.
#julialang #datascience
One aspect of the fun I had was learning interesting information about the data I used. I share my learnings here and look forward to hearing about yours.
#julialang #datascience
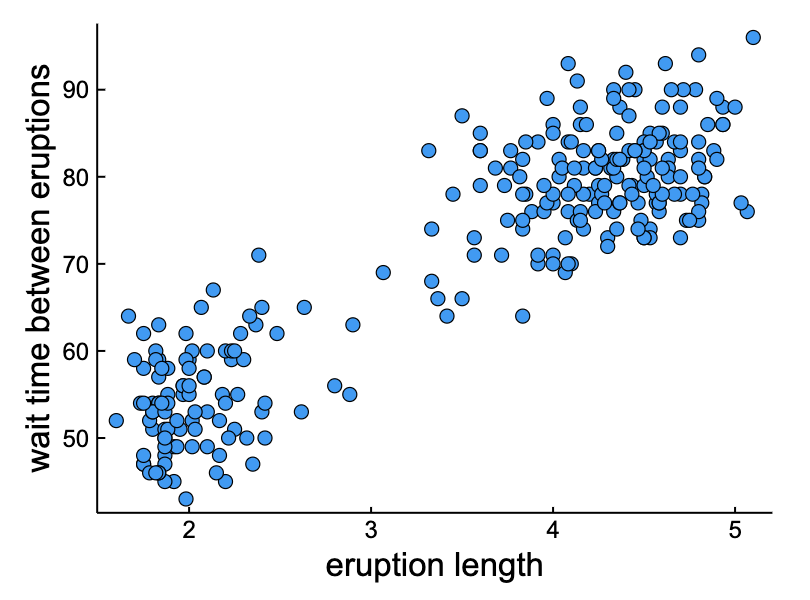
The next time you visit Yellowstone National Park to check out the Old Faithful geyser, know that if you wait for too long for the geyser to go off... you are likely to witness a longer eruption. 
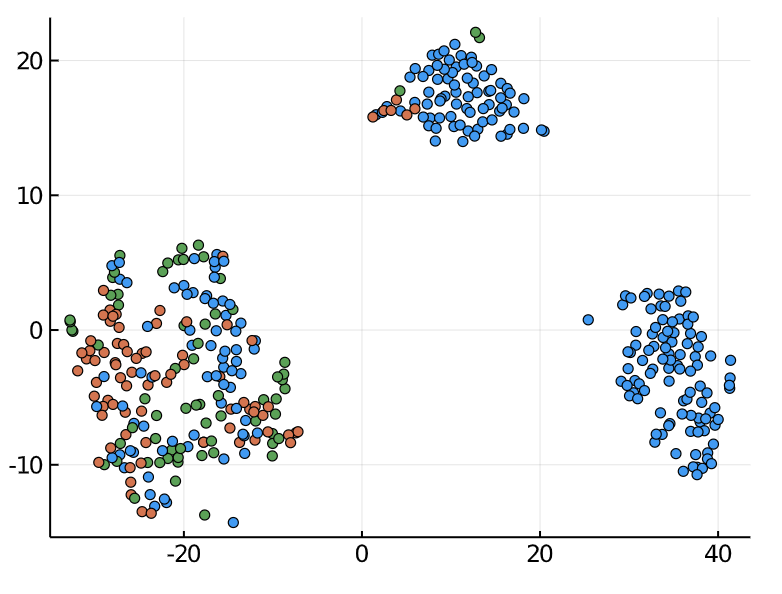
We use a cars dataset of car models with features such as horsepower and cylinders (& 5 more). We perform dimensionality reduction on this data & find out that European/Japanese cars cluster together whereas American cars form their own two clusters. But why? I'd love to find out
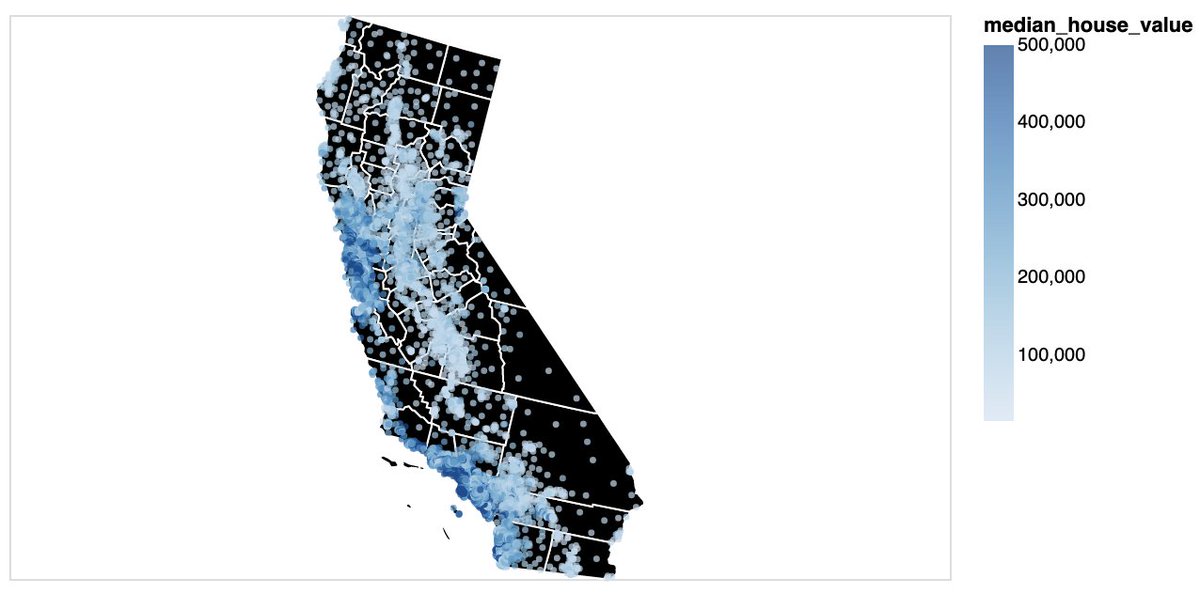
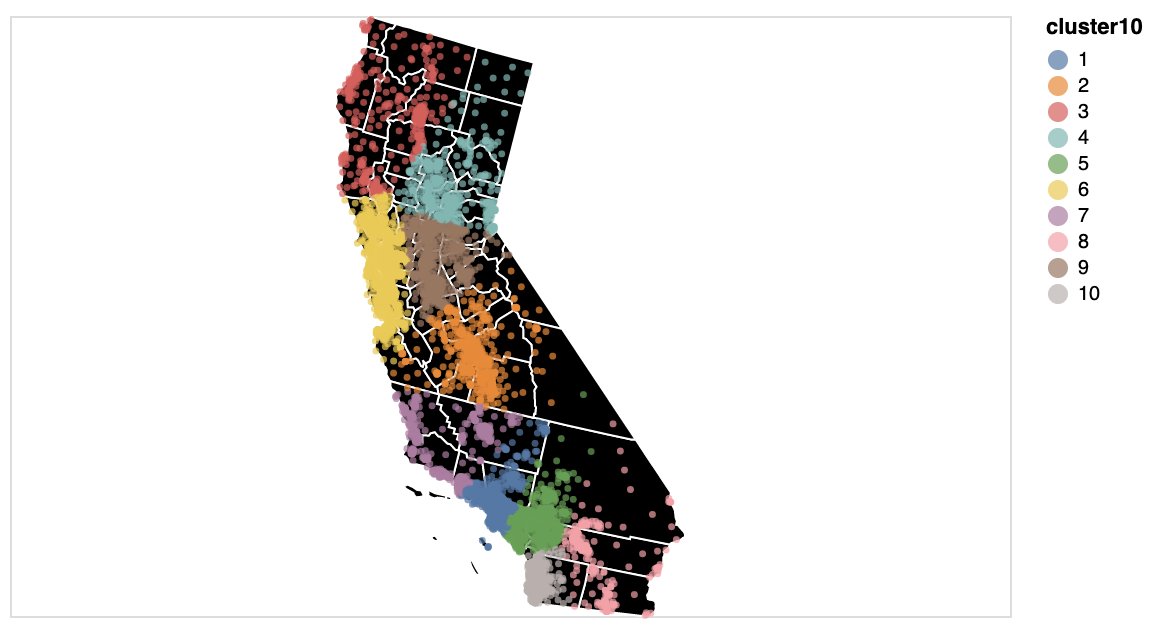
We perform clustering on houses in CA based on their geographic location. If anything, these clusters showed that housing prices isn't directly mapped to neighborhood -- there is a pattern in the prices themselves but that seems to be mainly determined by closeness to the water.
We run several classification methods: Lasso, Ridge, Elastic net, Decision tree, Random forest, Nearest Neighbors, and Support Vector Machines (on the famous Iris dataset) and built a score board of these methods. I'd love to see how this score board will look like on other data.
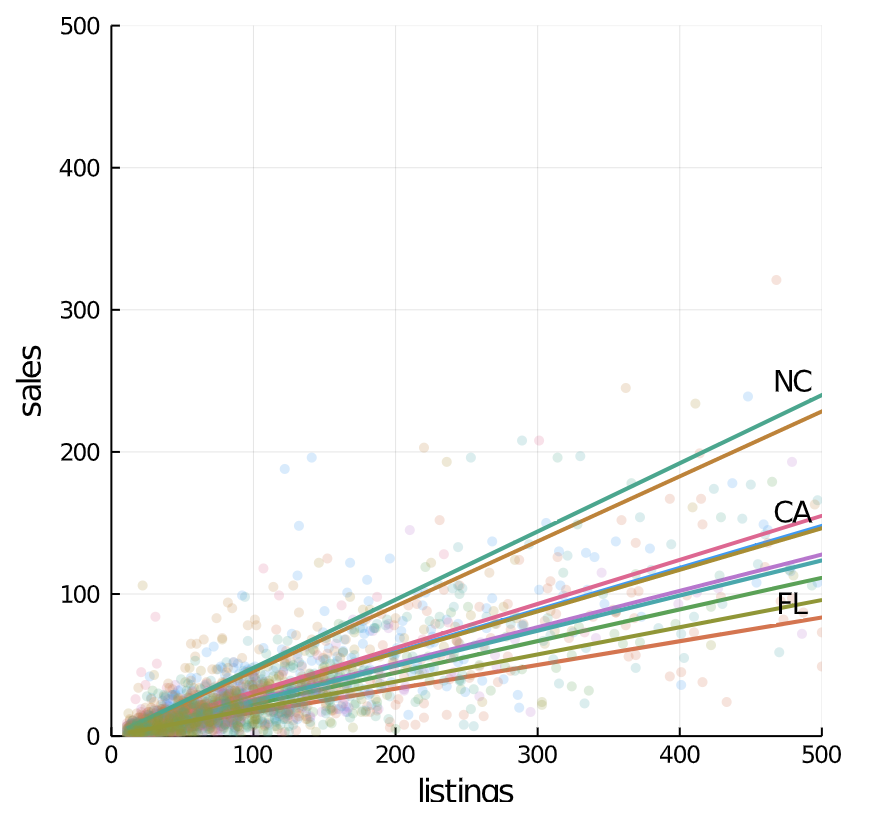
We use data from @zillow and built a regression model to see in which states the ratio of houses sold to the houses listed is highest. Turns out, North Carolina seems to be a winner here (this is data on Feb. 2020).
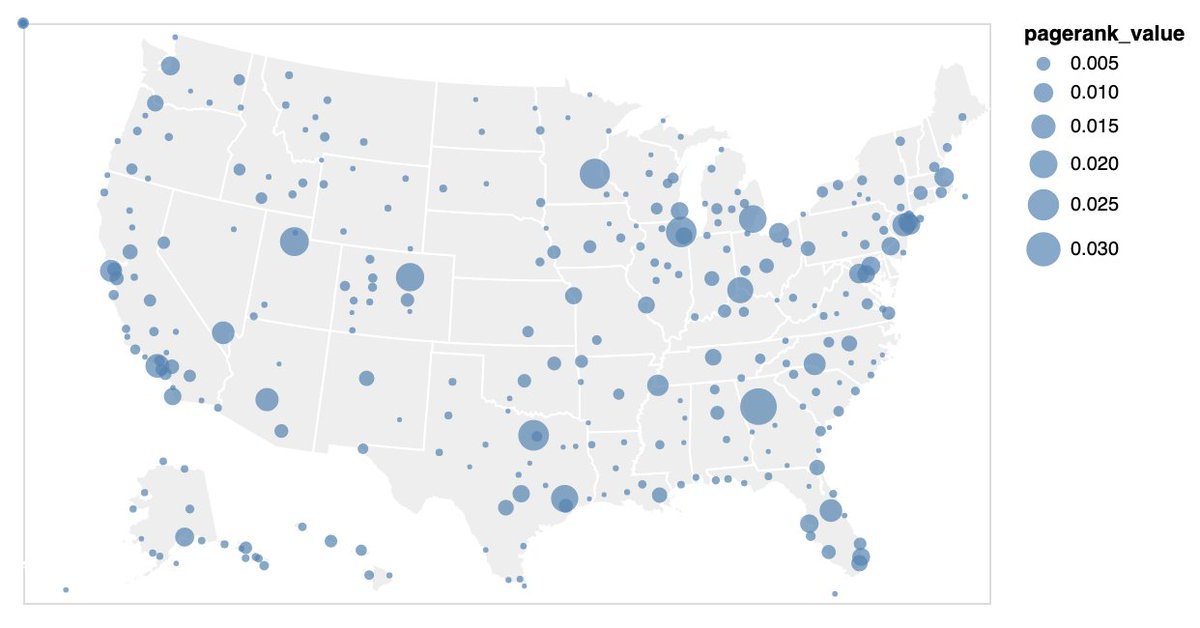
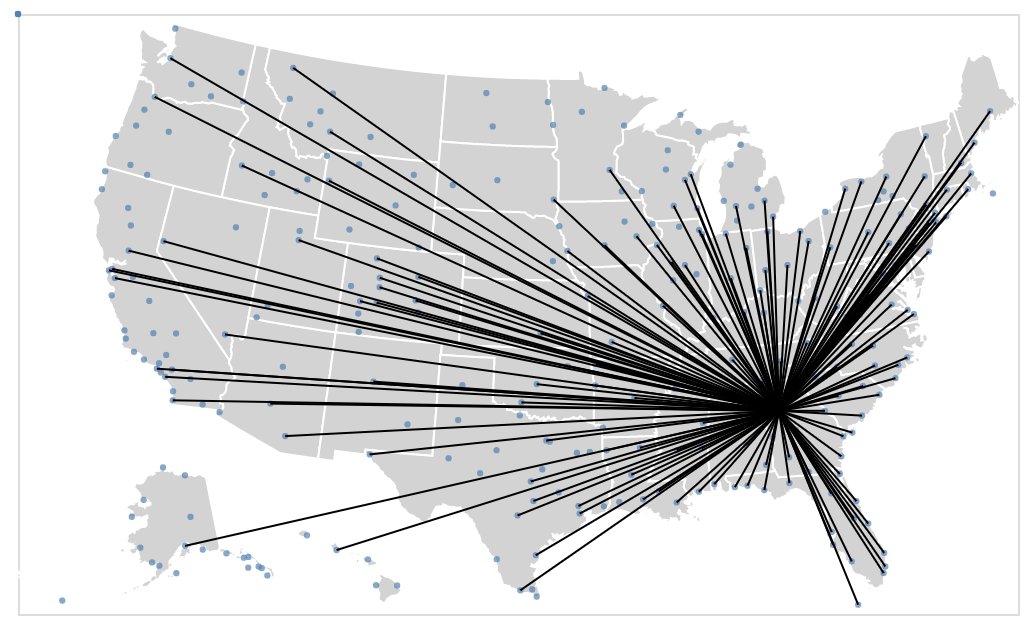
We work with a dataset of airports and flights within the United States. Spoiler alert: Atlanta has the highest number of flights from/to (duh!) and its PageRank value is one of the highest.
We got data from google finance (btw, it's really easy to get such data -- check out the `GOOGLEFINANCE` function you can use in G sheets) and performed a portfolio optimization problem. From the three companies we picked (FB, MSFT, Apple), most of the investment went to Apple.
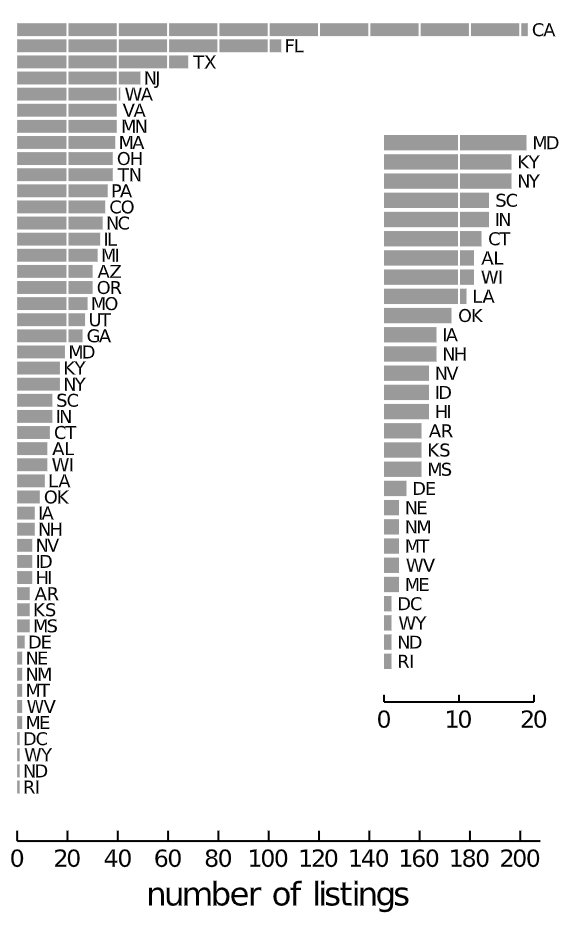
We played around more with the @zillow data on housing prices and listings... Here is a bar plot (not a big fan of bar plots but if you must, you gotta use Edward Tufte's style here). Not surprisingly, California had the highest number of house listings in February 2020.
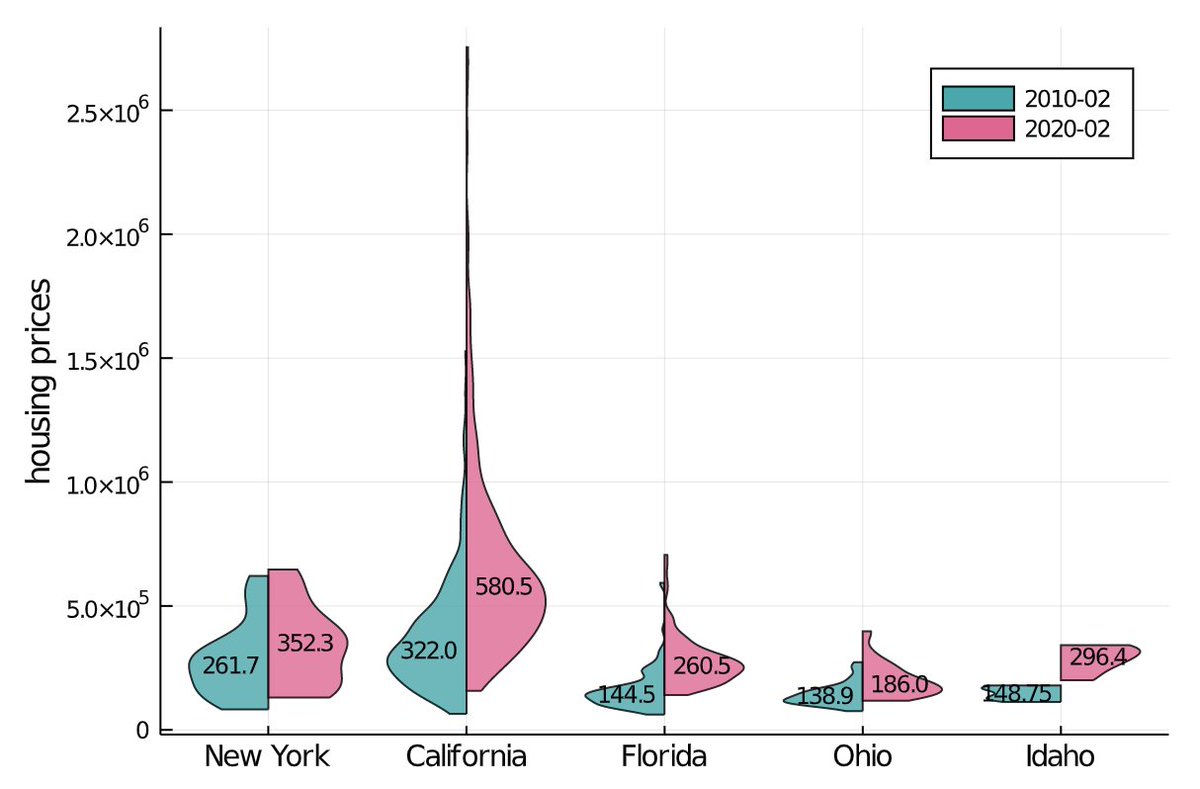
Another thing I learned from @EdwardTufte is the idea of symmetry. Here, you can see that you don't need both sides of the violin plot -- so I plot data from 10 years apart. Interestingly, the price distribution seems to be very similar except that the median has shifted upwards.
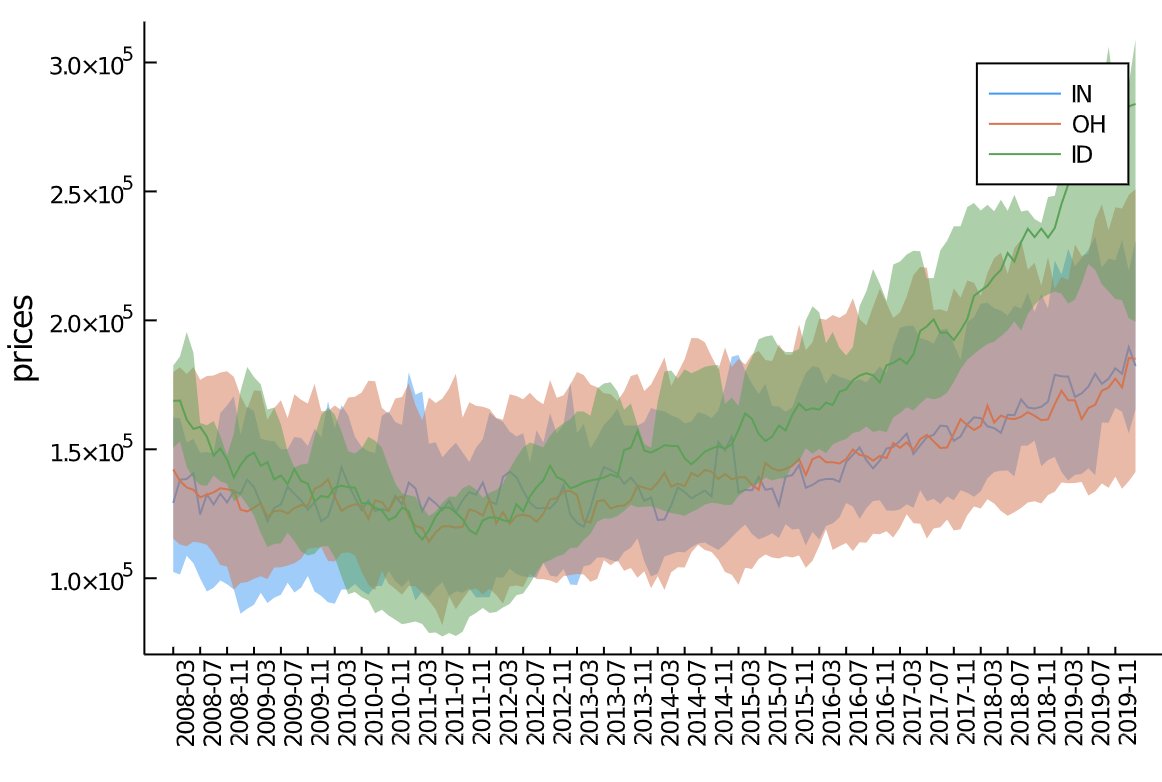
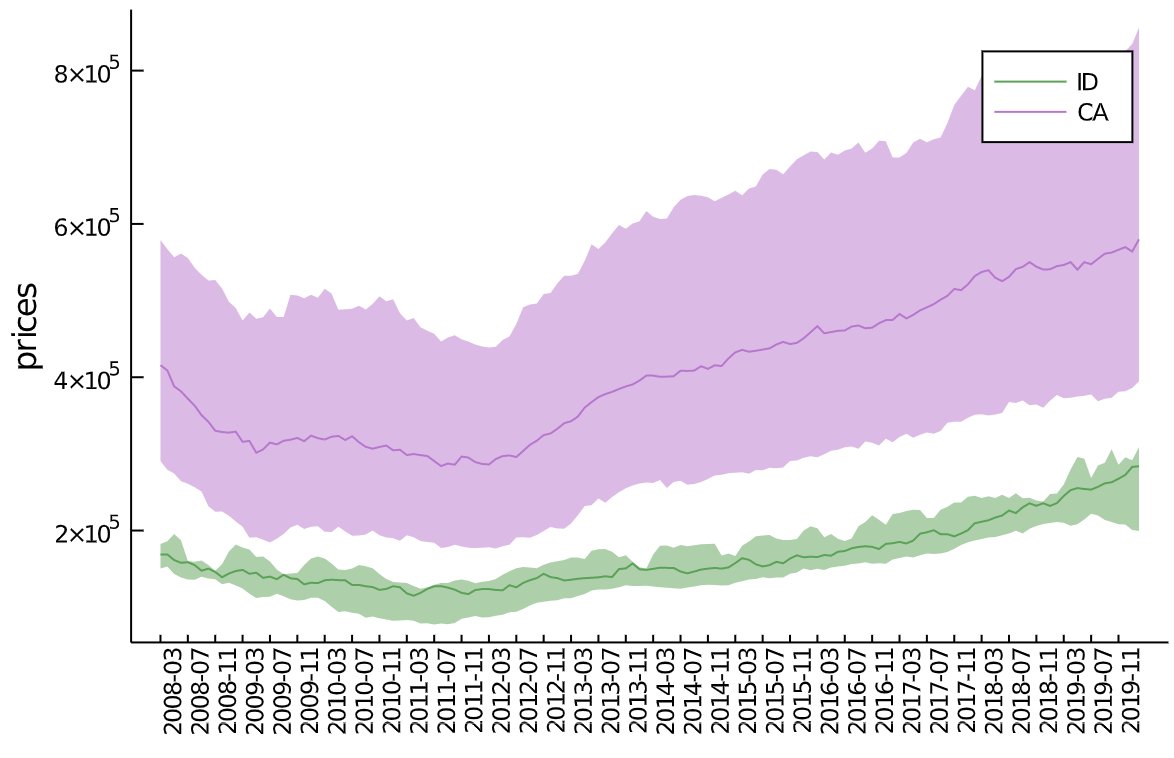
More Zillow houses prices over the years: Here, I show IN, OH, and ID -- and interestingly Idaho seems to have pretty much a different pattern. In the second plot, I see that Idaho seems to have a pattern similar to that of California. I thought that was interesting!
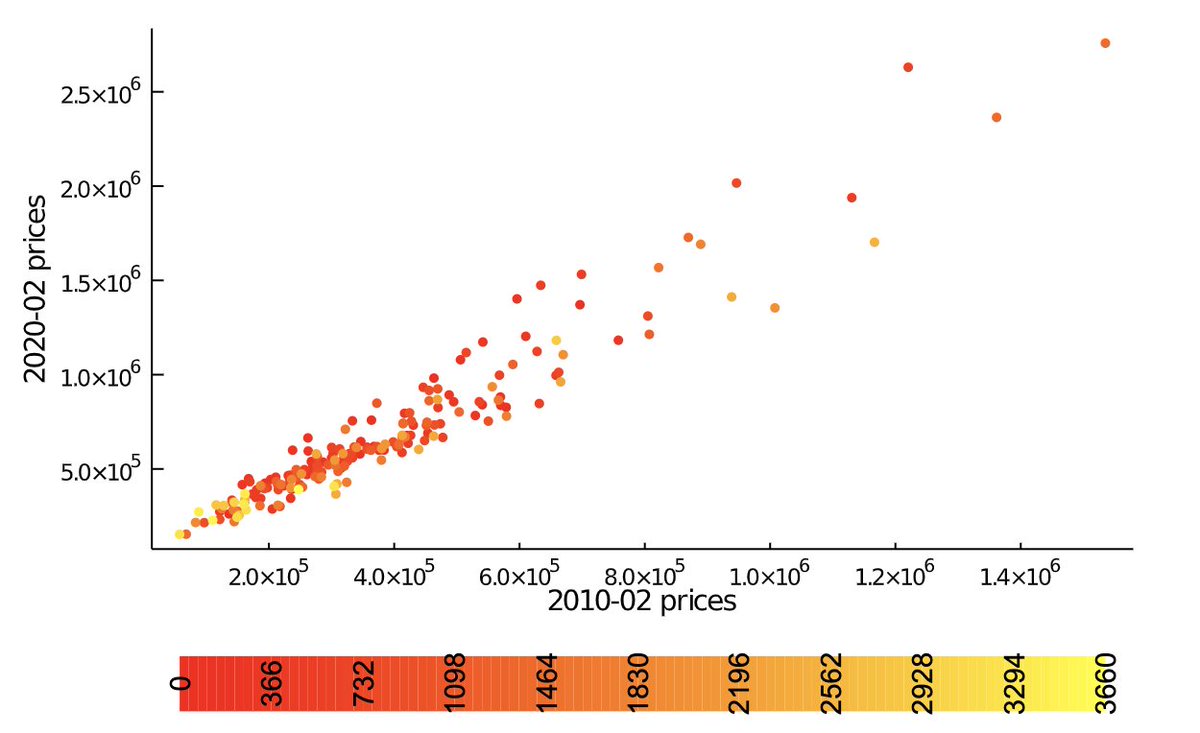
I'm not a big fan of 3D plots (though we do work on a 3D plot), I offer the solution of using color as a 3rd dim (or you can use size). Here, we see the prices from CA, (2020-02 vs 2010-02), and notice that the regions with higher prices are ranked higher (smaller rank number).
Finally, there are many aspects of the data that wasn't fully explored in this tutorial. Enjoy exploring the rest, and I look forward to hearing about your findings.
Bottom line: #julialang is an awesome language and if you've been putting off learning it, your time is now!
Bottom line: #julialang is an awesome language and if you've been putting off learning it, your time is now!

