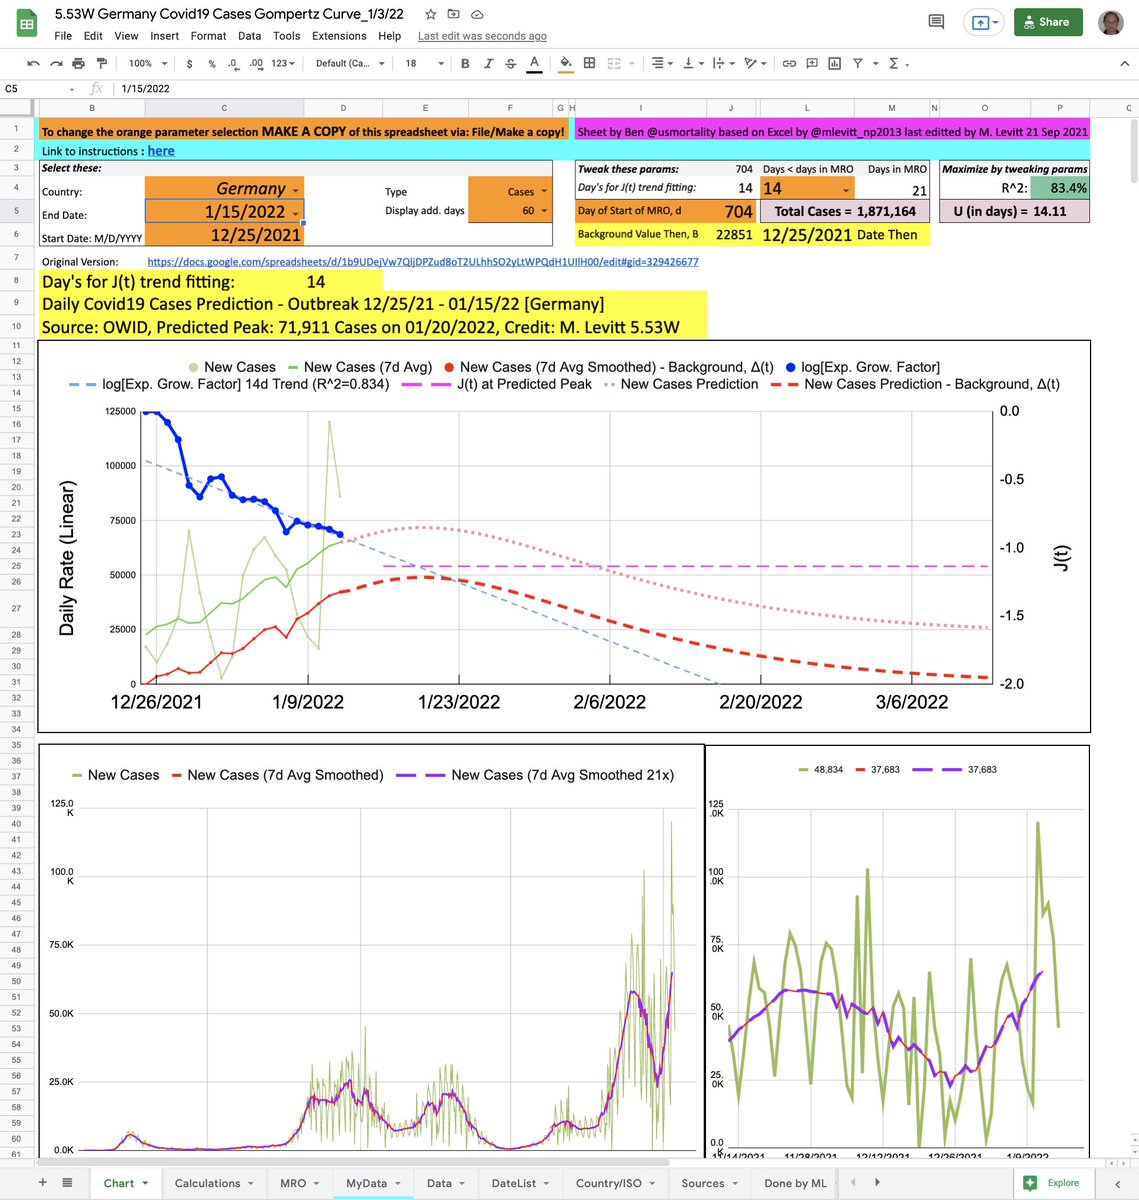
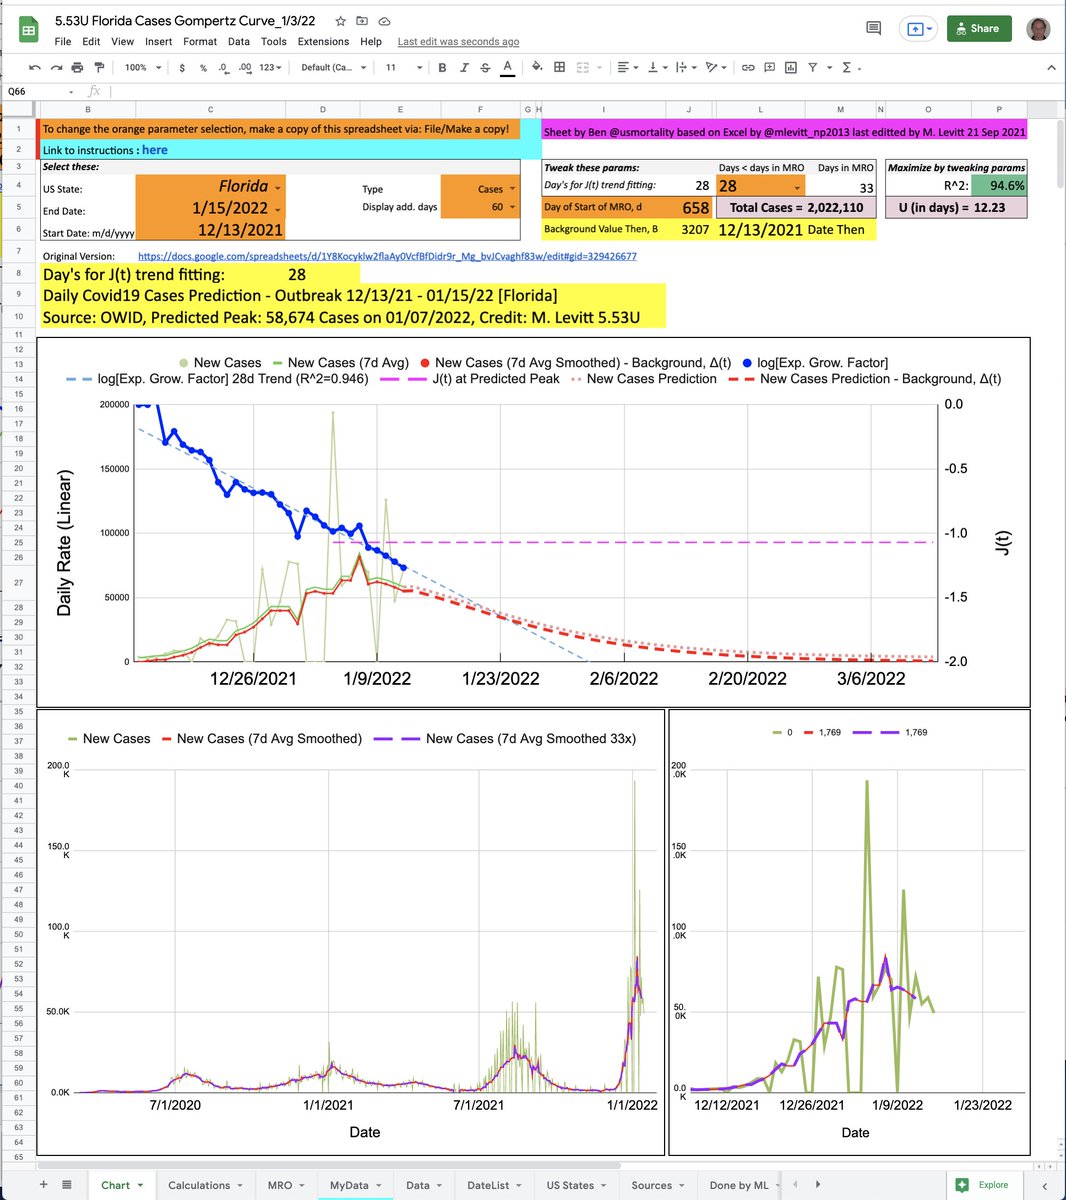
Here is my clearer analysis of the Population Fatality Rate (PFR) related to influential predictions by Ferguson et al. 2020. It use data released by the Chinese CDC on 14Apr20 @ChinaCDCWeekly, not full-text indexed by Google @Google but released in The @guardian on 1Mar20.
A perceptive reader will ask for the Verity et al., 2020 IFR. My 25Mar report to UK scientific leaders used that data. After normalization to percent, Verity IFR data is identical (0.6% RMSD) to deaths/Chinese_population in Col. F on Tweet1 Excel. My numbers are unchanged.
This analysis has been extraordinarily interesting. I will write it up as a PDF report with the Excel and also make a video today. Just shows that we can learn from every question and critique.
• • •
Missing some Tweet in this thread? You can try to
force a refresh
As someone who broke the news to Israeli leaders on Sweden’s handling of COVID-19 in Mar. 2020, I am so distressed to be reading this now m.ynet.co.il/articles/hj30k…
When will Homo Sapiens realize that we can never stop a tiny virus & re-engineer human biology by force not smarts?
Please note that the two translation are automatic. I give independent results from Microsoft and Google. The original is in Hebrew.
Taking this opportunity to rejoice in machine translation. It it so worthwhile to get used to its quirks.
Fortunately age-adjusted excess death in Israel for the 75 weeks from 1-Jan-20 to 6-Jun-21 is almost as small as that in Sweden (<2% of natural death in 75 weeks)
Economic, social, medical & educational cost to Israel likely higher than to Sweden.
2/8 Rather than make plots of one measure against another, we get the correlation coefficient of all pairs of measures.
Correlation coefficient, CC, of A to B is same as CC of B to A so table is symmetric. Correlation coefficient of A to A is always 1; it is whited out here.
1/7 Excess death (E) in any period is the difference between the actual all-cause deaths and those that are expected. Expected deaths in the current year, c, can be calculated in many ways. Easiest is to use the data from a few recent years as a reference (we use, 2017 to 2019).
2/7 Data can be used in 3 ways to calculate expected deaths. (1) as average death in the reference years. (2) as average corrected for the change in total population. (3) as average for each age band corrected for its population, what we call age-adjusted.
We use 5 age bands.
3/7 (1) If D(i) is death in reference years i, then expected death in year c is E(c)=average[D(i)]. (2) If P(i) is population; E(c)=P(c)*average[D(i)/P(i)]. (3) If (P(i,j) is population of age band j in year i, D(i,j) the corresponding death; E(c,j)=P(c,j)*average[D(i,j)/P(i,j)]