
Sentiment round-up
Bearish (-1): AAII, fund flows, BAML FMS
Bullish (+1): II, Panic/Euphoria, DSI, 10-day CPCE, one-month CPCE, NAAIM
Neutral (-1): Fear & Greed, Consensus
1 more measure moved up into the bull camp this week
Bearish (-1): AAII, fund flows, BAML FMS
Bullish (+1): II, Panic/Euphoria, DSI, 10-day CPCE, one-month CPCE, NAAIM
Neutral (-1): Fear & Greed, Consensus
1 more measure moved up into the bull camp this week
10-day equity-only put/call now at 0.53. Since 2004, a >5% drawdown was ahead, or if $SPX ran higher, all gains given back. It could take weeks to unfold 

Sentiment round-up
Bearish (-1): 4-wk AAII, fund flows, BAML FMS
Bullish (0): II, Panic/Euphoria, DSI, 10-day CPCE, one-month CPCE, NAAIM
Neutral (+1):1-wk AAII, Fear & Greed, Consensus
No big change from last week but CPCE, DSI and NAAIM have gone through the ceiling
Bearish (-1): 4-wk AAII, fund flows, BAML FMS
Bullish (0): II, Panic/Euphoria, DSI, 10-day CPCE, one-month CPCE, NAAIM
Neutral (+1):1-wk AAII, Fear & Greed, Consensus
No big change from last week but CPCE, DSI and NAAIM have gone through the ceiling
Would now be a good time to point out that equity ETFs + MFs had $4.6b in outflows in the past week? $30.5b outflow in the past 5 wks
https://twitter.com/sentimentrader/status/1269256793445859328?s=21https://t.co/OdNwuWC5PI
Consensus Inc still bearish
https://twitter.com/hmeisler/status/1269305372206157829?s=21https://t.co/XVna7zgvwO
$CPCE = 0.37 today. That’s about n=4 in the last 4,160 trading days

10-d avg $cpce = 0.47. N=1 in 16 yrs (April 2010)
Would now be a good time to point out that equity ETFs + MFs had a massive $20b inflow in the past week?
BAML: fund managers in June are still overweight cash and bonds and underweight equities. Within global equities, they’re hiding in the US. This is defensive positioning

The only time since 2003 that either 10-d or 21-d $CPCE has been lower than today was mid-April 2010 $spx
Woah, massive $25.5b outflow from equity ETFs + MFs in the past week (Lipper) $spx
II Bull/Bear ratio back over 3x (3.2x) for the first time since late January. It was just 0.7x at the low in late March. That’s how this works
https://twitter.com/hmeisler/status/1275746841490010112
Sentiment round-up
Bearish (+1): 4-wk AAII, 1-wk AAII, fund flows, BAML FMS
Bullish (-1): II, Panic/Euphoria, 10-day CPCE, one-month CPCE, NAAIM
Neutral (0): Fear & Greed, Consensus, DSI
Two wks ago, CPCE, DSI + NAAIM through the ceiling. CPCE still is, DSI now neutral
Bearish (+1): 4-wk AAII, 1-wk AAII, fund flows, BAML FMS
Bullish (-1): II, Panic/Euphoria, 10-day CPCE, one-month CPCE, NAAIM
Neutral (0): Fear & Greed, Consensus, DSI
Two wks ago, CPCE, DSI + NAAIM through the ceiling. CPCE still is, DSI now neutral
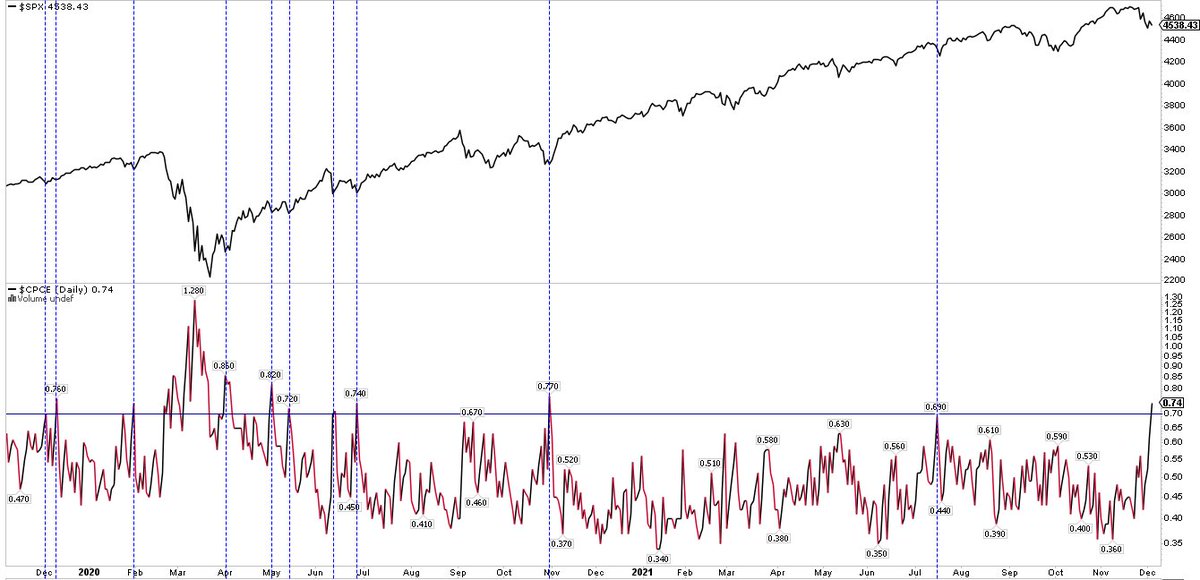
Today's $CPCE (0.74) the highest since May 1 $SPX
Equity MF + ETF fund flows positive into $SPX peaks in 2000, 2007 and 2015. Now, negative flows the past 4 quarters (unprecedented). Small sample but negative flows have corresponded to future $SPX gains. From JPM

Do fund flows contradict $CPCE and DSI for $COMPQ? Yes. Could be a short term (next month) vs longer term difference
$NDX $CPCE in the basement, normally (but not always) spells trouble before too long. From MKM

Huge equity MF + ETF inflow 5 weeks ago marked the exact recovery high in $SPX so far. Equity outflows every week since, but they are lessening (from Lipper)

Instead of breadth, I’d keep two eyes on this. Pretty consistent pattern after getting into the basement. Last 4 days avg of 0.43. Took a little more time in 2011 $cpce $spx

Sentiment (like Panic/Euphoria) works well at lows, not as well at highs, e.g., last Sept/Oct, March this year.
We’ve been through this many times before:
We’ve been through this many times before:
https://twitter.com/ukarlewitz/status/1128331867235602433
Sentiment indicator for annual gains (not next weeks or months) $spx
https://twitter.com/WillieDelwiche/status/1282688799898730497
BAML: fund managers in July are still overweight cash and bonds and underweight global equities. Within equities, they’re still hiding in the US. Neutral EU and EM.
Overall, this is defensive positioning
Overall, this is defensive positioning

When BAML FMs’ equity is exposure is this low, stocks generally do well, with one massive exception

BAML FMs’ have usually been right about the $USD; when they thinks it’s overvalued, it has mostly lost value.

Shorter term, one-month $CPCE back in territory where $SPX can go higher but has, in the past, always given those gains (and more) back. Like mid-Jan and end-May of this year

Two-week $CPCE: same conclusion, but sometimes more lag $SPX

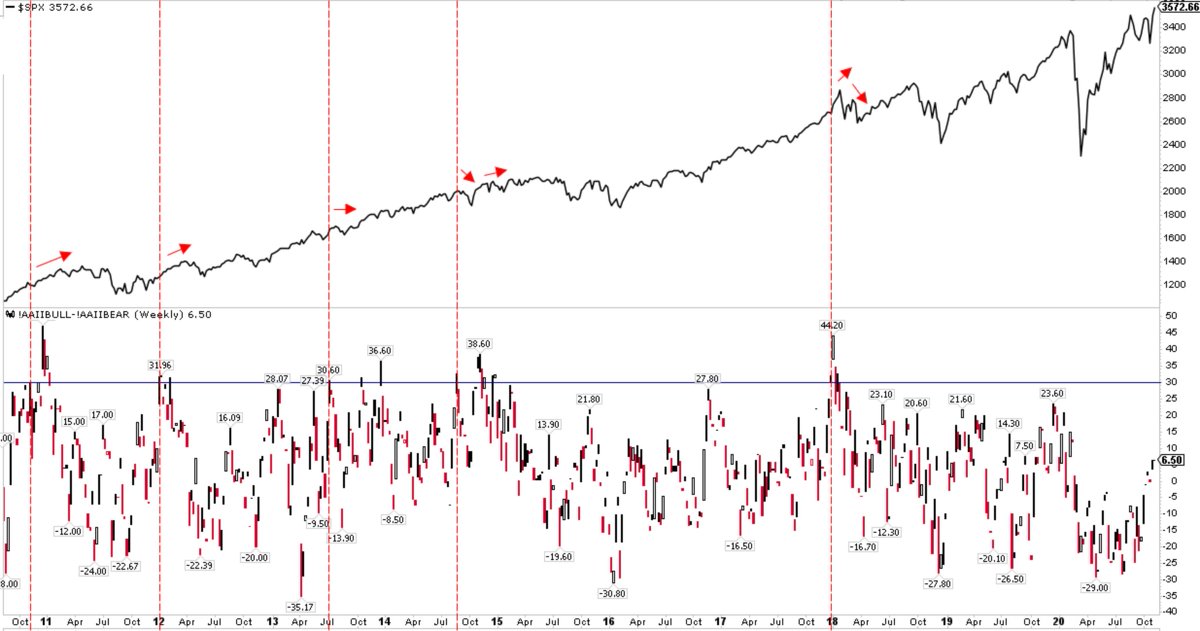
II bull-bear spread back above +40 for the 1st time since late Jan. Two misses (green arrows) but most often, gains given back if $SPX keeps moving higher (red arrows)

Sentiment round-up
Bearish (0): 4-wk AAII, 1-wk AAII, fund flows, BAML FMS
Bullish (+1): II, Panic/Euphoria, 10-day CPCE, one-month CPCE, NAAIM, DSI
Neutral (-1): Fear & Greed, Consensus
One guess is short term bullish sentiment extreme, but longer sentiment tailwind
Bearish (0): 4-wk AAII, 1-wk AAII, fund flows, BAML FMS
Bullish (+1): II, Panic/Euphoria, 10-day CPCE, one-month CPCE, NAAIM, DSI
Neutral (-1): Fear & Greed, Consensus
One guess is short term bullish sentiment extreme, but longer sentiment tailwind
Like AAII, Consensus is not showing a bullish extreme in sentiment $spx
https://twitter.com/hmeisler/status/1284508486156660744?s=21https://t.co/WBkoWJ3SfB
Margin debt on the sidelines

$21b MF + ETF equity outflow in the past 5 wks (Lipper)

Useful buy signals; not so much for sell signals. Scroll up for more
https://twitter.com/RenMacLLC/status/1293580683269505031
Meanwhile NAAIM (active investors) is now +100, i.e., leveraged long, for only the 8th time in its short history. 2 winners and 5 eventual losers but a very small sample size $spx

If you prefer ‘real money’ measures of sentiment, here’s one: after pulling $21b OUT of equity funds since early July, +$5.7b came IN this past week (Lipper)
https://twitter.com/ukarlewitz/status/1291443469769043968
One month $CPCE turning up from the lowest level in >20 years (lower panel). At the point where more put buying is usually (but not always) bearish $spx

I’d pay more attention to the last 2 charts from today than the ones having to do with Greenwich meridian, but to each his/her own and the more things line up, the more noteworthy
BAML: fund managers rotated into equities and out cash and bonds in August (top). Within equities, they’re overweight the US (bottom)
Overall, they are no longer bearish, but not yet outright bullish, i.e., they’re neutral
Overall, they are no longer bearish, but not yet outright bullish, i.e., they’re neutral

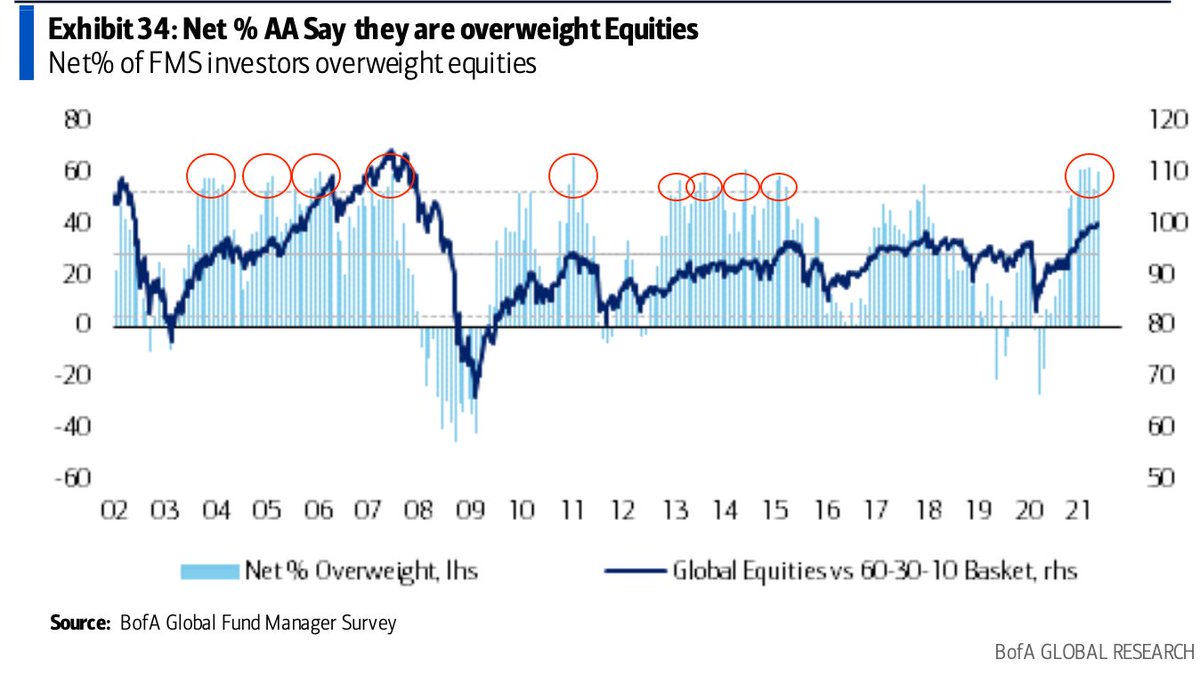
Not everything is necessarily contrarian. BAML fund mgrs maro optimism in 2003, 2009 and 2014 preceded much higher prices. 2002, not so much (circles)
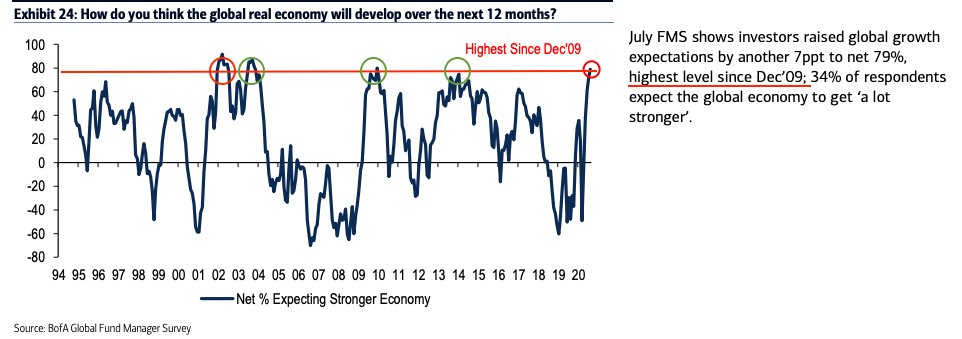
Fund manager global equity exposure has risen but is certainly not high (low end of neutral). Stocks generally do well

Exposure to US equities otoh is high; the region tends to underperform. The US is the global safe haven, so rotation into riskier regions is normal

Sentiment: meanwhile, the AAII 4-wk avg bulls minus bears is still buried at -19%, same as a month ago, with $SPX 5% higher
https://twitter.com/ukarlewitz/status/1283859230772977664
Sentiment: NAAIM hits 107, 2nd highest in its history. Active investors leveraged long equities. Dec 2017 only reading higher.

If you wanted to ignore one of the many sentiment readings, I’d make it NAAIM. Shortest history and the other ones are more meaningful. jmo
Meanwhile, the much derided AAII 4-wk avg bulls minus bears spread remains buried (at -14) for the 23rd week in a row, at the same level as 2 months ago w/ $SPX >10% higher. It works
https://twitter.com/ukarlewitz/status/1283859230772977664
Money has flowed OUT of MF + ETF equities 4 of the past 5 wks by a net -$20b (Lipper)

$CPCE 0.39 yesterday and 0.38 today. Last 15 years, it has been under 0.4 two days in a row once: April 14-15, 2010
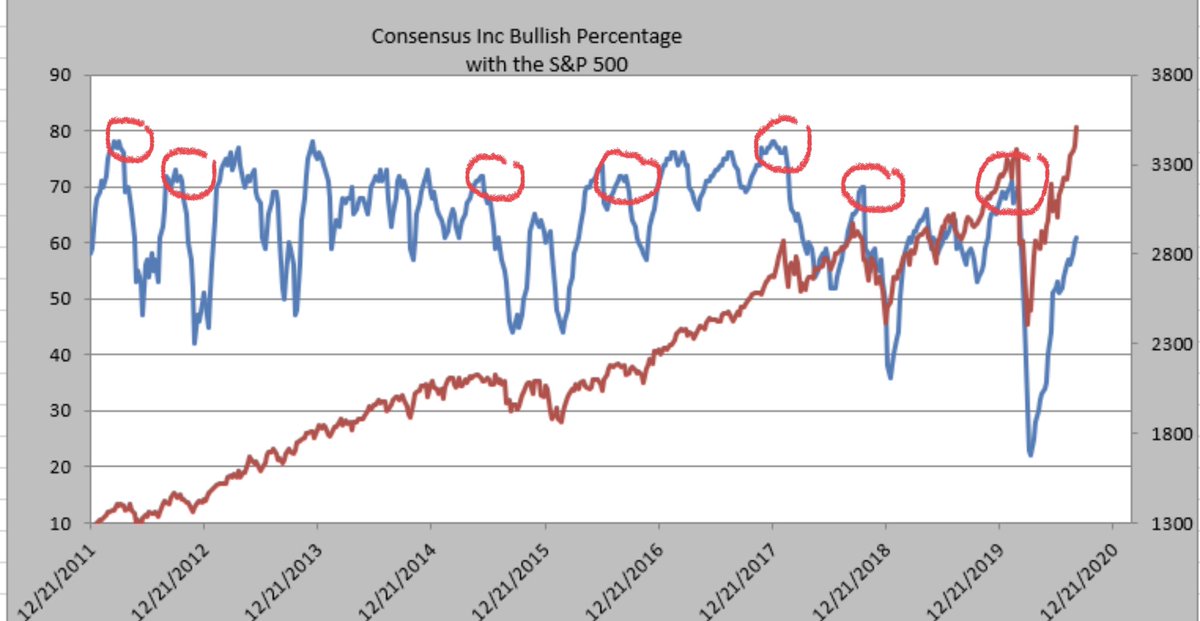
Sentiment: Consensus Bulls at 61%. Past 9 years, $SPX hasn’t run into trouble until it was over 70% (circles). h/t @hmeisler
Sentiment: Citi’s Panic/Euphoria hasn’t been this excited since 1999-2001. $SPX can go on but something naughty is ‘eventually’ ahead h/t @high5racing

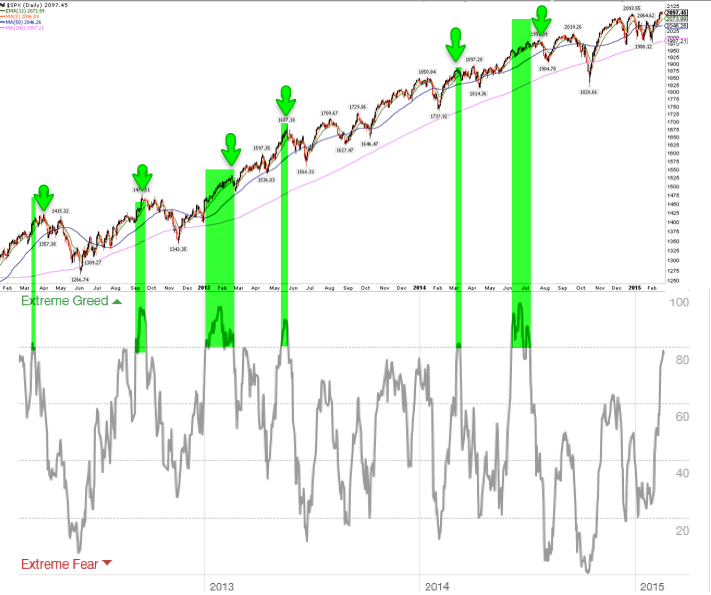
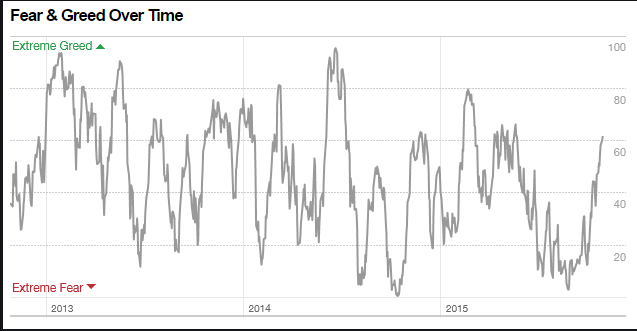
Sentiment: Greed at the level where $SPX can trip (red circles), but some big exceptions in just the past 3 years (blue circles). Fear, otoh, is pretty good at marking lows (arrows). That’s the way sentiment works (scroll up)

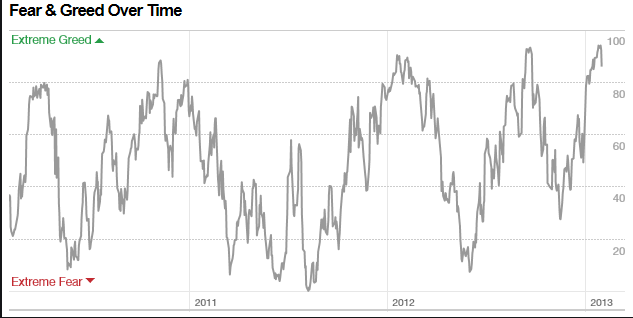
Sentiment: an older Fear & Greed chart (2012-2015) shows the same thing: that 80 level can mark a top, or $SPX might rise another few months. Certainly no tailwind

Consensus rises to 65 this week
https://twitter.com/ukarlewitz/status/1300072186271555585?s=20
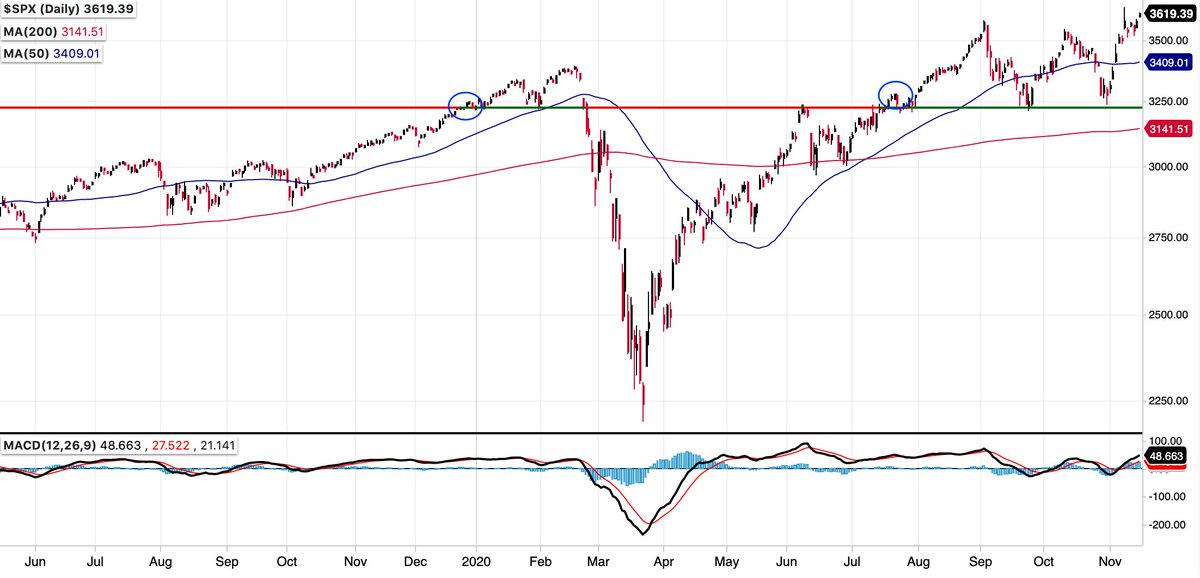
Insiders last month sold the most stock since Nov 2015. That seems bad as $SPX fell hard the next 3 months. But insiders sold heavily in 2017 and $SPX rose every month except 1 that year

Sentiment: The drop in $NAAIM from 106 to 53 was extreme enough to push it below its 2 std dev Bollinger Band. In all instances except one, a higher weekly close in $SPX was ahead in the next few weeks (I think this idea is originally from @HumbleStudent )

@HumbleStudent Sentiment: Market timers dropped equity exposure to 30%; Nasdaq exposure only 11%. “One of the most rapid retreats in more than 40 years"
marketwatch.com/story/this-1-b…
marketwatch.com/story/this-1-b…

Sentiment: $SPX now lower. All gains given back
https://twitter.com/ukarlewitz/status/1283428298719027201
Likewise: all gains given back $spx
https://twitter.com/ukarlewitz/status/1283399851934232578


Equity ETF + MF outflow of $14.9b in the past week (Lipper). That’s big; here are outflows >$15b in the past 10 years

Third biggest outflow ever
https://twitter.com/Reuters/status/1309437134198181889
$SPX - A higher weekly close from this post this week. The set up: a snap back after a shape fall in bullish sentiment
https://twitter.com/ukarlewitz/status/1304217718808215552
Sentiment: Not like the late-90’s
https://twitter.com/LizAnnSonders/status/1314164637554835456
Since then, $SPX up +7%, $RUT up +12%
https://twitter.com/ukarlewitz/status/1309152657215545345
BAML: fund mgrs continue to rotate out of cash and bonds and into equities, but overall all 3 of these are neutral. Within equities, the US has been and remains overweight

BAML: two months ago, slightly overweight cash and bonds and underweight global equities.
https://twitter.com/ukarlewitz/status/1295591918877851649
BAML: 3 months ago, FMs were more than 1 std dev underweight. Since then, global equities up +8%, US equities up +14%
https://twitter.com/ukarlewitz/status/1283066961207808000
Swing at the fat pitch or go home
NAAIM: Active investors were mega leveraged long (107) at the end of Aug (chart below). $SPX fell 8% in next few wks. Today, back to leveraged long (103)
https://twitter.com/ukarlewitz/status/1299007863319232517
In between, NAAIM fell hard (with $SPX); in the next 5 wks, $SPX rallied 7%, hence the swift rise in NAAIM
https://twitter.com/ukarlewitz/status/1304217718808215552
Hulbert: after a 10% gain in one month, extreme bullishness has returned (top 99% since 2000). Don’t expect a runaway market to the upside
marketwatch.com/story/stock-ma…
marketwatch.com/story/stock-ma…
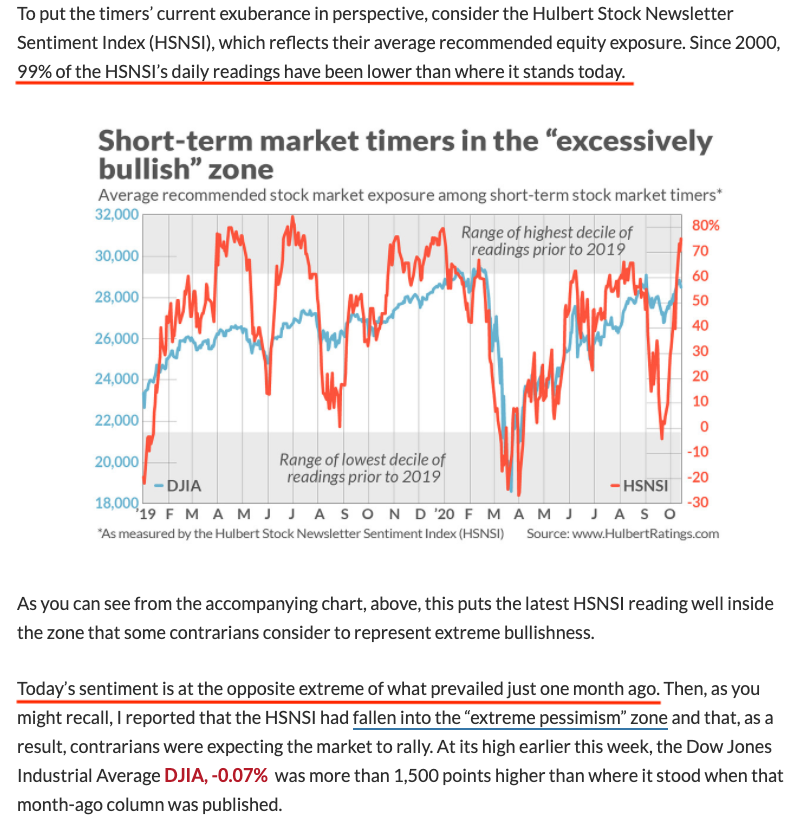

Sentiment: this is consistent with Hulbert and NAAIM. Scroill up
https://twitter.com/sentimentrader/status/1317188807633080327
The much maligned AAII bull-bear spread above zero (+3) for the first time since mid-February. Since then, $SPX +18%

Consensus bulls rises to 68 this week, the highest since the week of Feb 17
https://twitter.com/ukarlewitz/status/1300072186271555585
Robert Shiller sees a stock market crash: 2017-20


A crash is a greater than 1 standard deviation event. Since 1980, that’s 1987, 2001-02, 2008-09 and 2020

It did not runaway
https://twitter.com/ukarlewitz/status/1316900402344857600
Equity put/call doesnt get this low very often. If past is prologue, $SPX not likely to runaway and never look back $cpce

Sentiment: AAII bulls minus bears spikes up to +31. Chart below is the last 10 years >30 (1st instance in 6-mo). $SPX has gone up, down and sideways. Last time (Dec 2017) $SPX rose 8% in next month, then dropped 9%
AAII bulls 56%. Stats below for spread >55% since 1987. $SPX bias still higher; 6-mo later, all 12 instances higher by median 7.5%. From @NautilusCap

Standard comment on sentiment: bullish and bearish extremes are not the same
https://twitter.com/ukarlewitz/status/1128331867235602433
Recall >80% of stocks now above their 200-d. Combine that with the spike in positive retail sentiment. FinTwit says former is bullish but latter is bearish, which doesn’t work. But it’s what you should expect: when investors bullish, they buy everything and so breadth expands
Equity MF + ETF inflows of $24b this week. That’s very big
https://twitter.com/hmeisler/status/1326930930804645903
Big inflows have been more rare than a Yeti. The only week remotely similar in 2020 was June 8. Inflow of $20b. $SPX dropped 8% in 5 days. n=1.
“It doesn’t pay to immediately assume a bullish public will automatically be proved wrong. Not every rally is hated, not all upside progress happens in ironic repudiation of the consensus”
Article for the above quote:
https://twitter.com/michaelsantoli/status/1327985854980218882
Largest equity fund inflow in at least 20 years
https://twitter.com/adam_tooze/status/1327637413338857472
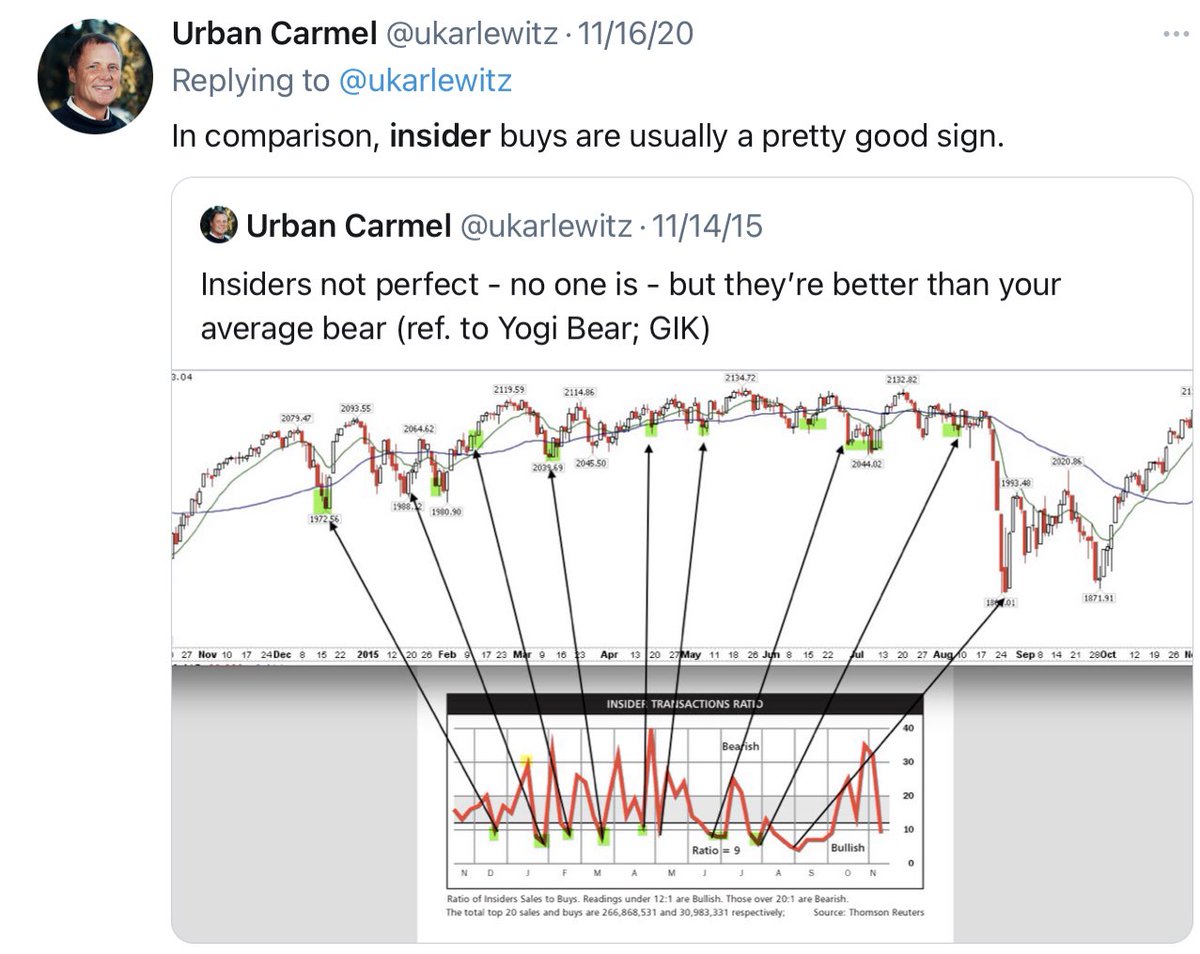
Spike in insider selling. Not a big fan of this data as it could be attributed to the end of the blackout period. Prior spikes in the past year havent led to a fall in $SPX (1st two charts). Likewise, a massive spike in Feb 2017 led to more upside in $SPX (2nd two charts)
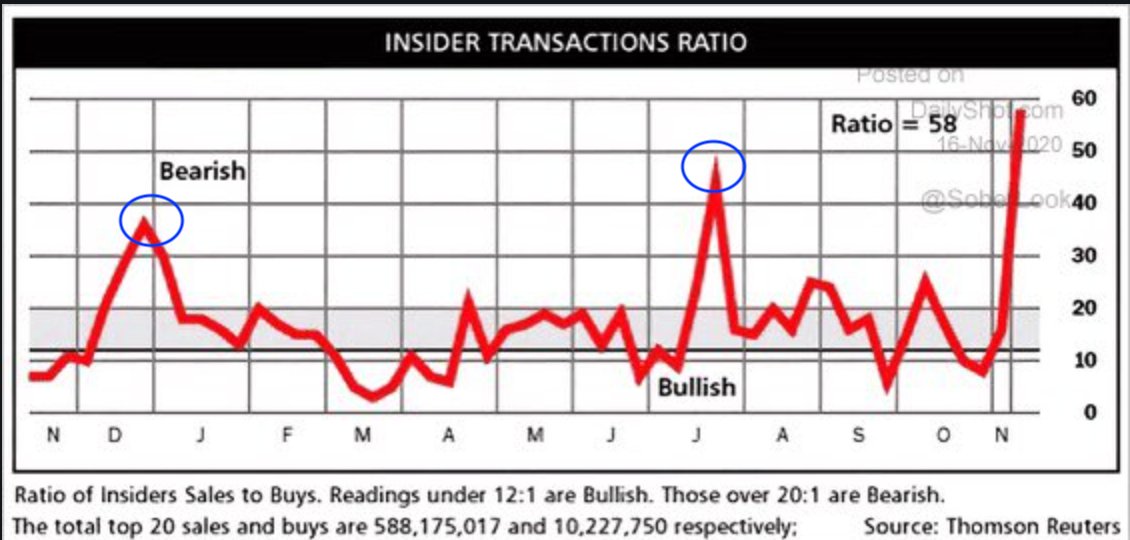
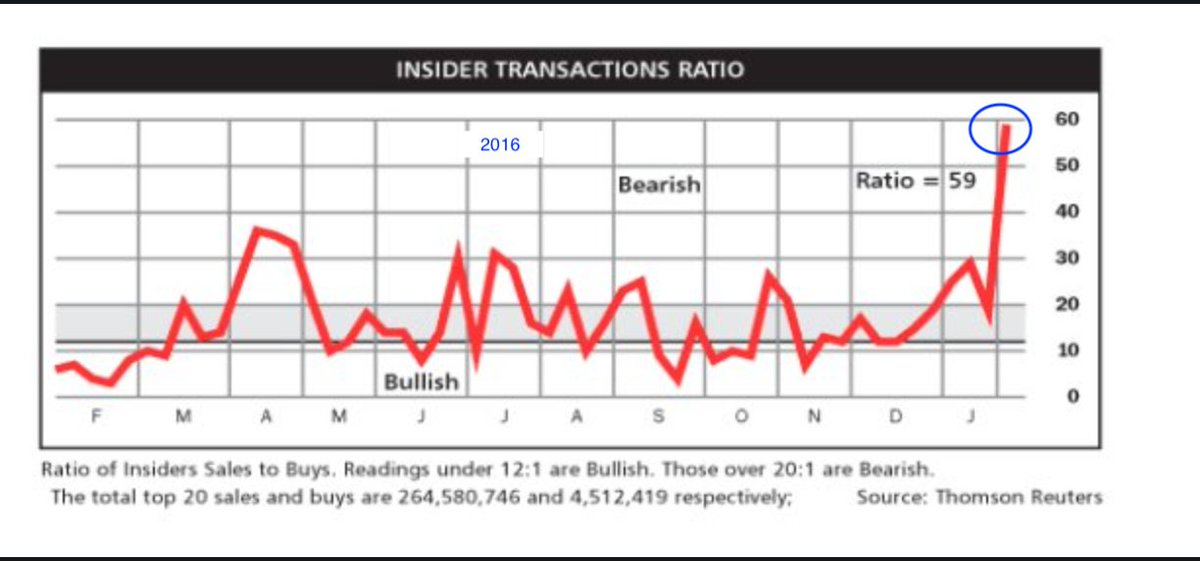

In comparison, insider buys are usually a pretty good sign.
https://twitter.com/ukarlewitz/status/665626402247479296
For the 1st time since January, fund managers are firmly bullish. Cash and US equities more than 1 std dev from the mean and global equities very close to being so.
https://twitter.com/ukarlewitz/status/1316051271606923264

See prior chart on the energy sector. So hated, even the UK is more liked
https://twitter.com/dailydirtnap/status/1328472352280207361
$SPX annual gains are slim to none when sentiment at current levels. Like breadth, the best annual gains occur when sentiment is weak. These things go together
https://twitter.com/WillieDelwiche/status/1329053364953485312
More confirmation of bullish sentiment, with NAAIM back at 106 this week. Stuff below from last time
https://twitter.com/ukarlewitz/status/1316782968304615424
Two weeks later, and $SPX is right where it was
https://twitter.com/ukarlewitz/status/1326138914063708161
Fear & Greed at 88. When over 80, $SPX is sometimes (not always) at/near a short term high; if $SPX continues higher, it usually (not always) gives those gains back. That’s how bullish sentiment works

$CPCE back down to 37 today. See tweets below. 10-d and 21-d avgs are at Sept 1-2’s 20-year lows
https://twitter.com/ukarlewitz/status/1329895975914065920
Investor Intelligence Bulls - Bears Spread at +48% for a 2nd wk in a row. Peaked at +46% in late August and +41% in late Jan. Charts below show last 20 yrs. $SPX can drop or chop sideways for many months; if it just goes higher, those gains normally given back


Active managers (NAAIM) leveraged long for the 3rd week in a row (103). The only other time NAAIM has been >100 three wks in a row was late August
https://twitter.com/ukarlewitz/status/1316782968304615424
Pfizer Slashed Its Covid-19 Vaccine Rollout Target After Facing Supply-Chain Obstacles - WSJ
If everything going to plan was part of your 2021 forecast, allow me to introduce you to Kahneman
If everything going to plan was part of your 2021 forecast, allow me to introduce you to Kahneman
https://twitter.com/ukarlewitz/status/1309583566859198464
$NAAIM (active managers) leveraged long w/ 4-wk MA at ATH. Mattered in August but not at all in 2013-14 or 2017

Doesn’t feel like the late 1990s (at all) but this says otherwise. In any case, we know from that period that (a) this can go on for a long time before it ends and (b) gains are eventually given back

Ignore this week’s $12b outflow from equity EFTs + MFs. Happens every December


Most recent instance market timers very bullish was mid-Oct. $spx -7% in next 2 weeks. Post below. But everyone should know by now that excessive bullish isn’t the symmetrical opposite of excessive bearish
https://twitter.com/ukarlewitz/status/1316900402344857600
From 5 months ago. $SPY underperformed $VEU by 600bp since then. $EEM is now consensus overweight for 2021.
https://twitter.com/ukarlewitz/status/1295725406998257664
Fund managers’ EM allocation +1.9 standard deviations from the mean. ATH


Active managers (NAAIM) at 113 (leveraged long) this week. That’s never happened before. Consistent with $CPCE, Citi's Panic/Euphoria and BofA’s Sell Side gauges. Scroll up on the non-symmetry of these measures
Here’s the BofA Sell Side update
https://twitter.com/SBarlow_ROB/status/1352233405283512321
Here’s the latest Citi Panic/Euphoria chart
https://twitter.com/sharkbiotech/status/1351860162886307841
Here’s NAAIM, referenced above. I mention it mostly because other measures concur. On it’s own, it has problems as documented before in this thread (short history, long lags, false signals)

Equity only put/call <0.4 on 7 days so far in 2021 (including Monday) and today’s sell off has undercut the $SPX close on all of them
https://twitter.com/ukarlewitz/status/1347014893052968963
Flows in and out of equity MF + ETFs has been oddly muted the past 5 weeks (from Lipper)

$CPCE goes boing to the highest level since Nov 2 (0.58)
https://twitter.com/ukarlewitz/status/1354520840583356416
Understanding insider transactions 1 of 3
https://twitter.com/HumbleStudent/status/1355673917239619587
Insider transactions 2 of 3
https://twitter.com/ukarlewitz/status/1328368370324893696
Insider transactions 3 of 3
$11b equity MF + ETF outflow last week, which is notable next to the relative calm recently. Last outflow like this was the week before the US election
https://twitter.com/ukarlewitz/status/1354887418294353921
$CPCE 21-d avg = 0.4 today, a new 20+ yr low.
Also, new ATHs in $SPX $COMPQ $NDX $WLSH $RUA and $RUT
Also, new ATHs in $SPX $COMPQ $NDX $WLSH $RUA and $RUT
$CPCE under 0.4 today (lower panel). The last one started the late January drop. After prior instances, $SPX hasn’t been able to run higher and never look back

$26b equity MF + ETF inflow this past week. That’s unusually large. Last year, happened in June (big drop) and the week after the November election (sideways for a week, then higher)

The string of sub 0.4 $CPCE starting Feb 8 now entirely retraced like every prior time

$CPCE 0.35 today

More than $50b inflow to equity MF + ETFs over 3 wks. That’s big (Lipper)

Yesterday’s low $CPCE immediately rewarded with today’s -2.4% drop in $SPX. Thanks for the fish

$CPCE pops to 0.63 today, the highest since Oct 30
https://twitter.com/ukarlewitz/status/1365091983677530113
A 4 month high in $CPCE, combined with the turn of the month, giving a nice fillip to $SPX today
https://twitter.com/ukarlewitz/status/1365473892056227843
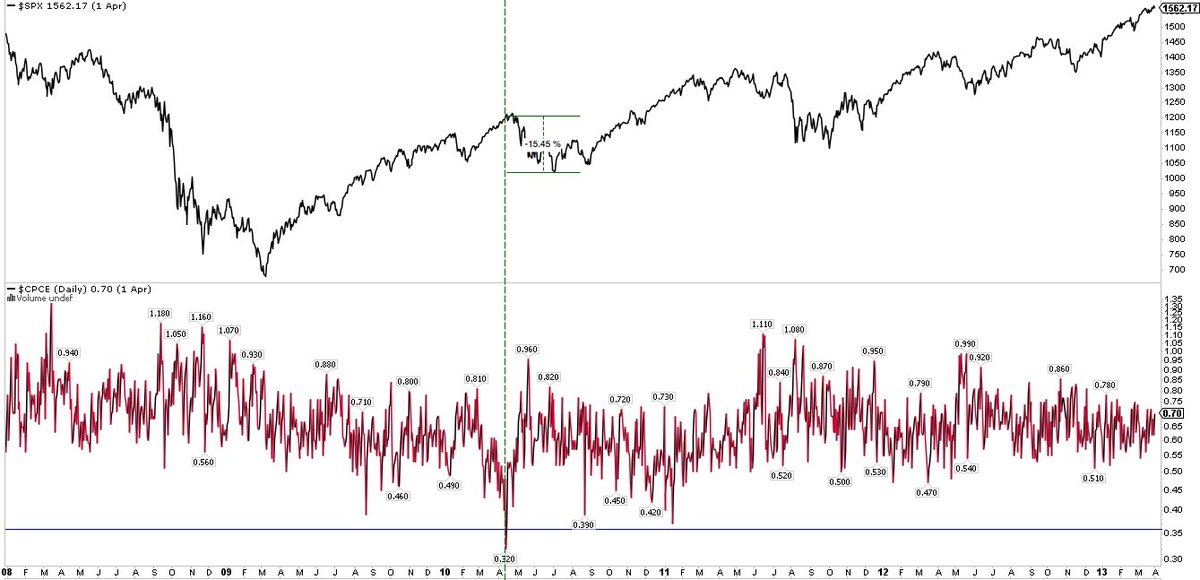
Over the past two weeks, $SPX has dropped 4%. On one measure at least, don’t be surprised if more volatility is ahead.
One-month $CPCE (red line) is now the lowest in 20 years. The only comparable period is the late-90s (chart from Tom McClellan)
One-month $CPCE (red line) is now the lowest in 20 years. The only comparable period is the late-90s (chart from Tom McClellan)

Those red arrows in the prior chart show other times during 1998-2000 when one-month $CPCE was as low as today. The chart below blows up 1998-2001. This period was marked by more gains in $SPX but also a high frequency of 5-10% swings. It wasn’t glide higher

Getting back to the original chart, the bigger drops in $SPX (more than 10%; blue arrows) came only after one-month $CPCE had been rising (blue lines), not when it was sitting at a relative low

So, Friday’s jump in one day $CPCE relieved short term complacency. The watch out now is whether it heralds a transition to more protection (higher one-month $CPCE) that *could* preceed a more meaningful top
The usual caveat about market action not being the product of single variables applies
The “sell side indicator” never made any sense. It said participants were bearish when Greenspan uttered “irrational exuberance”, bullish at the end of tech crash and more panicked in 2013 than anytime during the GFC

Active investor equity allocation (NAAIM) has fallen from 110% to 65% since the $SPX peak 3 weeks ago.
$SPX dropped -4% since the most recent two sub-0.4 $CPCE readings

The 5% drop in $SPX is consistent with the prior pattern in CPCE. One-month has risen from 0.4 to 0.45. A continued rise sets up this bigger pattern. Scroll up
https://twitter.com/ukarlewitz/status/1366443835270656001
NAAIM fell from 110 four weeks ago to 49 this week, pushing it below its lower Bollinger. Higher high for $SPX odds on. Notes on chart. h/t @HumbleStudent

Another $14.8b this week brings the last 5 wk equity MF + ETF inflow total to over $65b (Lipper)
https://twitter.com/ukarlewitz/status/1365011233691234305
Why bullish sentiment is harder to read and use than bearish sentiment:
https://twitter.com/ukarlewitz/status/1128331867235602433
This chart is making the rounds again. Since 2013 (arrow) it has been used to show that the bull market is over because investors have too much money in equities. $SPX up +140% since then.

Prior chart: a post from 4 years ago on why this measure is not valuable. $SPX up +80% since then
https://twitter.com/ukarlewitz/status/1004717062848049152
$18.3b is the 2nd biggest weekly equity MF + ETF inflow this yr. Scroll up for more (Lipper)

The biggest weekly inflow came the week of Feb 8 and $SPX is now unchanged from that date.
It takes bulls to make a bull market but too many bulls and the cops show up and send everyone home
It takes bulls to make a bull market but too many bulls and the cops show up and send everyone home
Remember the very low $CPCE on Monday? Pepperidge Farms remembers

$CPCE 39 Monday and $SPX now -1.3% lower. Today's pop to 57 is a level that has seen $SPX pop the 3 other times it’s happened this year

Scroll up to March 1 for a longer term view of CPCE using a 1-mo MA. This is a thread for a reason
$SPX popped +2% from yesterday’s open
https://twitter.com/ukarlewitz/status/1374873706812477441
3 weeks later and $SPX at a new ATH. This has been a good tell
https://twitter.com/ukarlewitz/status/1370057022364807173
Daily sentiment on $SPX over 90. Prior instances the last 3 years


NAAIM back to 90, which is smack dab in the middle of the last 20-wk range
I think this is the only reliable set up using NAAIM data:
I think this is the only reliable set up using NAAIM data:
https://twitter.com/ukarlewitz/status/1370057022364807173
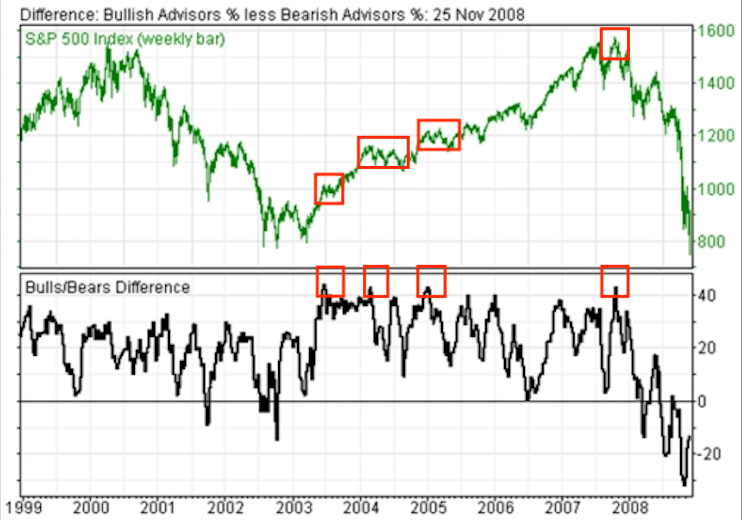
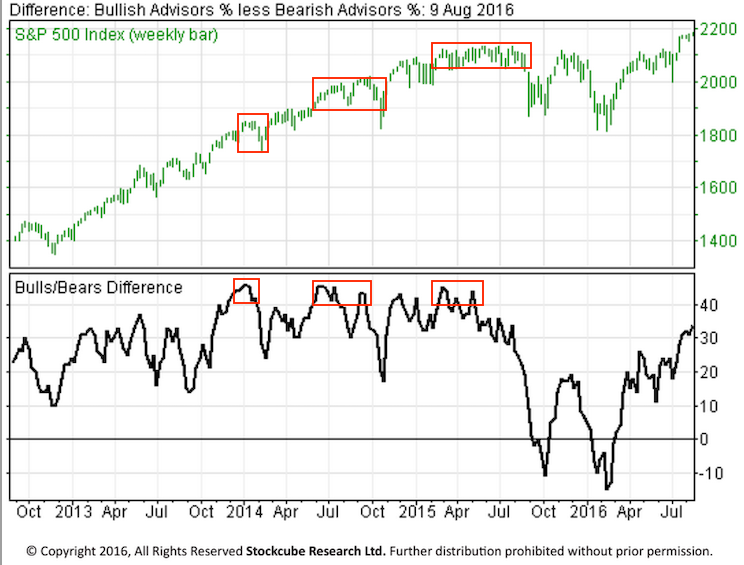
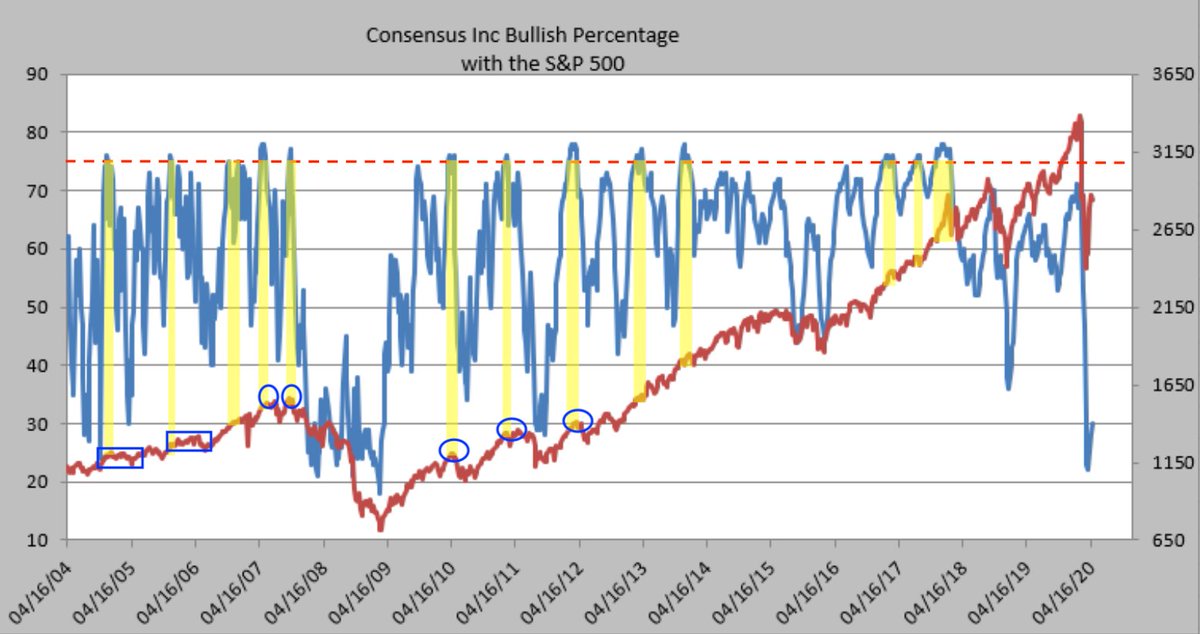
Consensus bulls at 75%, a level not reached since early 2018. Doesn’t get much higher
From 2004-2012, either extended chop (boxes) or a notable top (circles) followed (1st chart)
Since then, more likely to rise further and then give those gains back (arrows; 2nd chart)
From 2004-2012, either extended chop (boxes) or a notable top (circles) followed (1st chart)
Since then, more likely to rise further and then give those gains back (arrows; 2nd chart)

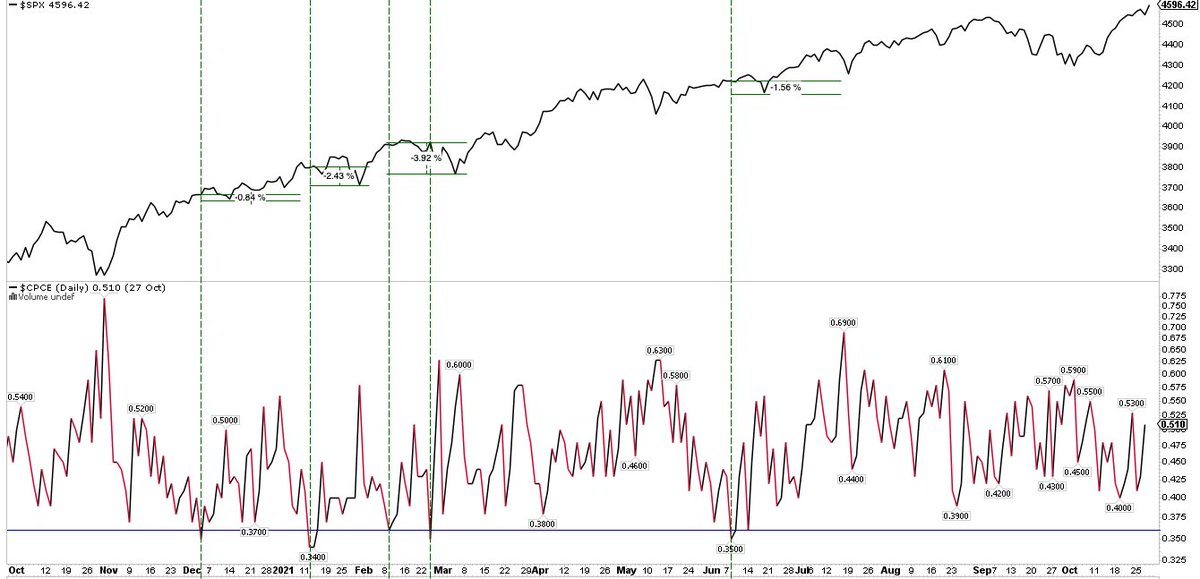
The slow rise in 10-d avg $CPCE off a 20+ year low isn’t the positive signal it’s being betrayed as being. See next tweet

$CPCE popped to 0.52 today, highest in a month. Last 1 yr, when $CPCE crossed above 0.5, $SPX closed higher by avg 1.9% w/in 5 days in 17 of 19 instances (89%). R/R >2:1 pos
$SPX +1.1% on Day 1
https://twitter.com/ukarlewitz/status/1385391689838198784
$SPX up +1.9% on Day 5
https://twitter.com/ukarlewitz/status/1385391689838198784
NAAIM over 100 (leveraged long; bottom panel). $SPX can run higher (blue lines) or chop/drop (red lines) over the next few weeks. In all but 2, any further gains given back (arrows)

$CPCE is rising (10-d avg shown below). It doesn’t mean what you might think it means

$NDX daily sentiment reaches the March 4, 2021 low. Here’s last 3 yrs

$CPCE pops to highest since Feb 26. A bounce is high odds. Not necessaily the low

Two days later, $SPX +2.8%
https://twitter.com/ukarlewitz/status/1392655157247184903
The Fear & Greed Index hasn’t fallen below 20 (fear) since the March 2020 low. That’s an unusually long time. No year in the past 10+ has avoided at least one ‘fear’ episode, even mega bullish years like 2013 and 2017
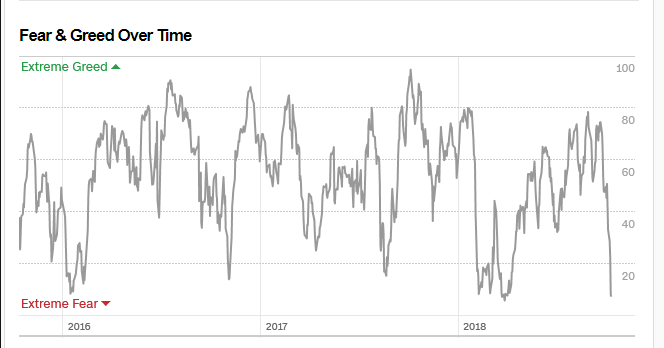

$SPX (upper panel) when Fear & Greed falls below 20 (lower panel)

$CPCE drops below 40 (to 37) for the 1st time since April 5. Scroll up for charts
https://twitter.com/ukarlewitz/status/1374873706812477441
This chart has been making the rounds. MS’s market timing indicator as high as 2000, 2008 and 2018 (bad!) and also 1990, 91 and 92 (not bad!). Overall, looks like a small sample/coin toss $spx

Since then, $NDX +6.5%
https://twitter.com/ukarlewitz/status/1392612427858993153
$CPCE at 35, lowest since Feb 24 and Jan 13
https://twitter.com/ukarlewitz/status/1400263580952395776
Fund managers are 61% overweight global equities, which is +1.3 std dev above the mean. Bond allocations are at a 3-yr low (-1.4 std dev below mean). This hasn’t been when equities have outperformed a 60-30-10 portfolio for long. From BAML

$CPCE has printed sub-40 three times in the past 11 days. $SPX was lower the next day each time and today it's about 1% below the level of even the first one. Follow what works
https://twitter.com/ukarlewitz/status/1402446908585512960
All gains and more given back a month later and now even more than two months later $SPX just 0.8% higher
https://twitter.com/ukarlewitz/status/1381625543439777792
Wild guess: equity inflows will not be anywhere as strong in the 2nd half
https://twitter.com/RobinWigg/status/1410893465458708486
$CPCE popped to 59 today. That’s usually been good for at least a one day boiunce in the past year

$SPX now nearly +1%
https://twitter.com/ukarlewitz/status/1413308651700330503
Investors Intelligence bull/bear ratio reached 4.0x this week for the first time since Oct 2017-Jan 2018 (shaded area). $SPX ran up +12% during that period then gave it all back and was net flat a year later

Fear & Greed 23 today, the lowest since the pandemic bottom in March 2020 (it dropped to 25 the day before the Nov election). Below 20 is odds on
https://twitter.com/ukarlewitz/status/1394401181003173889
$CPCE Friday pops to 69, the highest since the election. In the past +1 yr, this has been a multi-day bottom for $SPX

Fear & Greed below 20 (16) today, just like every prior year
https://twitter.com/ukarlewitz/status/1416148859470761987
A week later and it drops to 3.18x. $SPX fell just 2.8% (closing basis) and is already back within 1% of ATH
https://twitter.com/ukarlewitz/status/1415307671285104644
Most of the time when bullish sentiment drops as much as it did this week, $SPX has bottomed, unless there is a 100-yr pandemic. From @McClellanOsc

$8.8b MF + ETF equity outflow in the past week, the 2nd largest of 2021 after the $11b outflow at the end of Jan after a -4% drop in $SPX (Lipper)
$SPX +16% since then
https://twitter.com/ukarlewitz/status/1367120626197045251
In the event, $SPX +0.9% and $NDX +1% this week
https://twitter.com/CapitalComped/status/1421530514725294083
$CPCE 0.39 today. Add that to the channel top

Even the pessimists turned bullish today. Tweets below: same person, exactly a month apart, during which $SPX rose 3% and made a quadrillion new ATHs

Mom and Pop sentiment (AAII 4-wk avg) at the most bearish since Oct last year. Not yet extreme but more times than not, this isn’t the time to be a pessimist $spx

Prior tweet: adding data back to 1990

$9.3b MF + ETF equity outflow in the past week, the 2nd largest of 2021 after the $11b outflow at the end of Jan after a -4% drop in $SPX
Last two weeks: $16b outflow (Lipper)
Last two weeks: $16b outflow (Lipper)
https://twitter.com/ukarlewitz/status/1418283486180306945
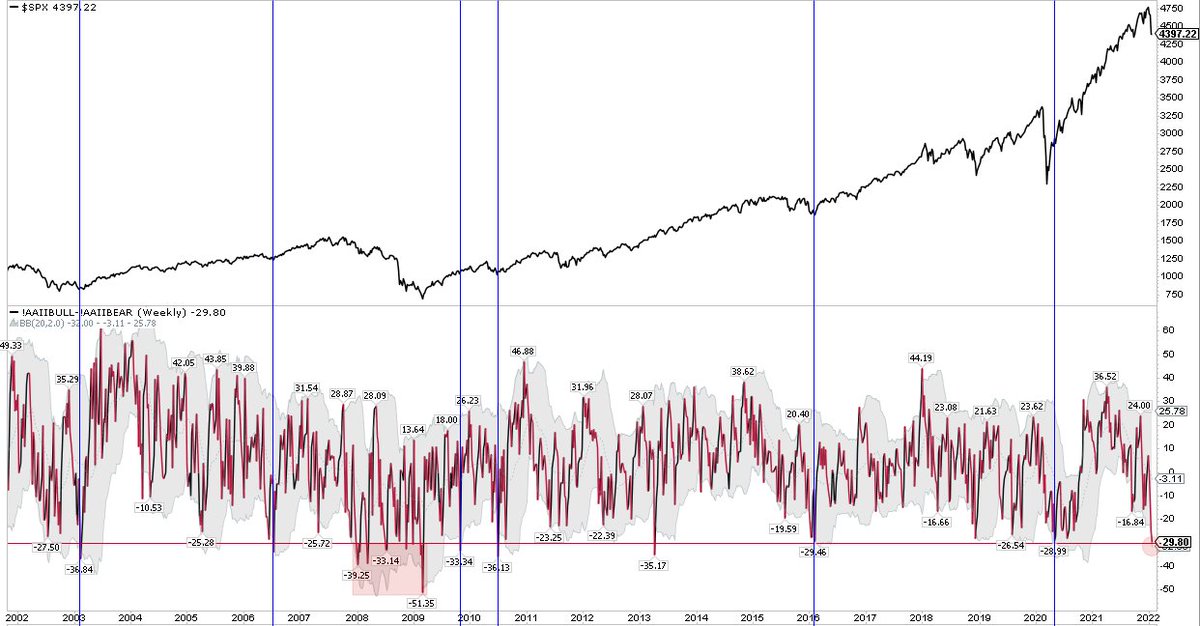
Dropped to -13 this week, which is below the green line. See comment below
https://twitter.com/ukarlewitz/status/1443584987299606541
Chart for prior tweet

A wide spread exists between good and bad market timers (LHS). $SPY during similar times (RHS). Read the source footnote
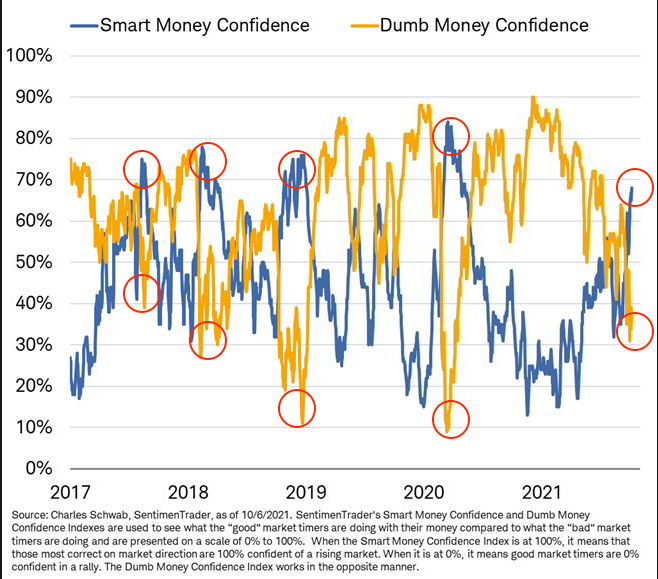

Since then, $SPX fell less than 1% and is now 5% higher
https://twitter.com/ukarlewitz/status/1443584987299606541
AAII bull-bear spread went from -13 to +19 in the past 3 wks. The 4-wk avg is back to zero (neutral)
NAAIM went from 55 to 98 over those same 3 wks
https://twitter.com/ukarlewitz/status/1451173596114690048


Today I received a DMCA takedown notice for reposting a Citibank Panic/Euphoria chart 7 months ago. I see this chart being reposted everyday so not exactly a secret
https://twitter.com/ukarlewitz/status/1374439995000246273

Here it is if you want to see a recent update
https://twitter.com/Johan_Elmquist/status/1445645901091934212
Active investors (NAAIM) back to leveraged long (103%) for the first time in 6 months. More often than not leads to something (red lines) but often enough it doesn’t making it hard to use on it’s own (green lines)

Likewise, +$15b inflow into equity MF + ETFs this past wk is the largest in 7 mo and the 4th largest of 2021. Past 2 wks +$26b inflow (from Lipper)
And likewise, $CPCE drops to 0.36, the lowest since mid June and one of the lowest in 20 years. Here’s all instances since 2004. Spot the pattern

Fear & Greed at 78, the highest since late Nov + Dec last year. See comments and charts below
https://twitter.com/ukarlewitz/status/1331303876243324929
Active managers (NAAIM) now 108% leveraged long. n=4.
Happened in Jan and Feb this year and $SPX down 3% soon after.
Two other times in 2017: tax cut fever in Oct (SPX ripped higher) and Dec (ripped higher then gave it all and more back and was unchanged 5 months later)
Happened in Jan and Feb this year and $SPX down 3% soon after.
Two other times in 2017: tax cut fever in Oct (SPX ripped higher) and Dec (ripped higher then gave it all and more back and was unchanged 5 months later)

Fund managers the most overweight US equities in 8 yrs (Aug 2013). Small sample but tendency to underperform when the consensus is this lopsided. From BAML

Took a month but $SPX closed lower today (all gains given back)
https://twitter.com/ukarlewitz/status/1453893611779616768
Fear & Greed back down to 22. We’ve been down here 3 other times this year (vertical lines and blue text). F&G was 86 the day small caps peaked 3 weeks ago
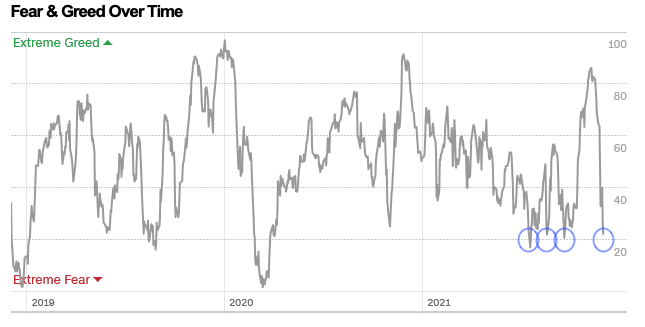

$SPX is down 4% from its ATH; the very broad Russell 3K is down 5%. Fin Twit feels like the deathly hallows. Low volatility years like these make everyone super sensitive to every little nudge
Spend 2 seconds on Fin Twit and you’ll see why equities fell 5% in Sept, rose 10% in Oct and then fell 4% again. Overreacting in both directions is what equities do. Set your sails on things like macro but trim based on psychology because that’s what drives ‘short term’ action
Since 1980, $SPX has fallen an avg of 14% intra-year. Take out the worst 8 yrs - where $SPX fell 20-50% - and the avg is still a fall of 10%. This year’s max is just 5%. You’ll likely see mean reversion in the next 12 mo. Get yourself mentally prepared
https://twitter.com/ukarlewitz/status/1466211012361609218
$CPCE >60 for the first time since Aug. All instances since the election shown below

Things got pretty extreme on Friday. $CPCE at the highest since the 8% DD before the election (LHS). $VIX at one of the highest levels in 10 yrs (RHS). Unless we’re repeating the pandemic crush, this looks like capitulation

Nothing works perfectly all the time but here’s another tailwind. Give yourself an early holiday gift and head on over to @sentimentrader.

4-wk AAII bull-bear spread (-10) at lowest since wk of Oct 4. Usually a tailwind for $SPX

NAAIM (active managers) drops to 52, the lowest since the wk of May 17. They were leveraged long (>100) at the end of Oct/beginning of Nov when small caps hit ATH. That’s how this works
End of year fund flows get super funky so take whatever is printed with a pound of salt
https://twitter.com/ukarlewitz/status/1073383816587182081
That’s a 2 standard deviation move in NAAIM. See note on chart

There was a major regime change after the pandemic: in the past 18 mo, this has been where investors seeking protection has peaked (and an $SPX low has formed), but before Covid it was more likely to mark a peak in risk-seeking $cpce

$SPX +3% two weeks later. Fin Twit bearish right before X-mas. Naughty naughty
https://twitter.com/ukarlewitz/status/1471514887075491854
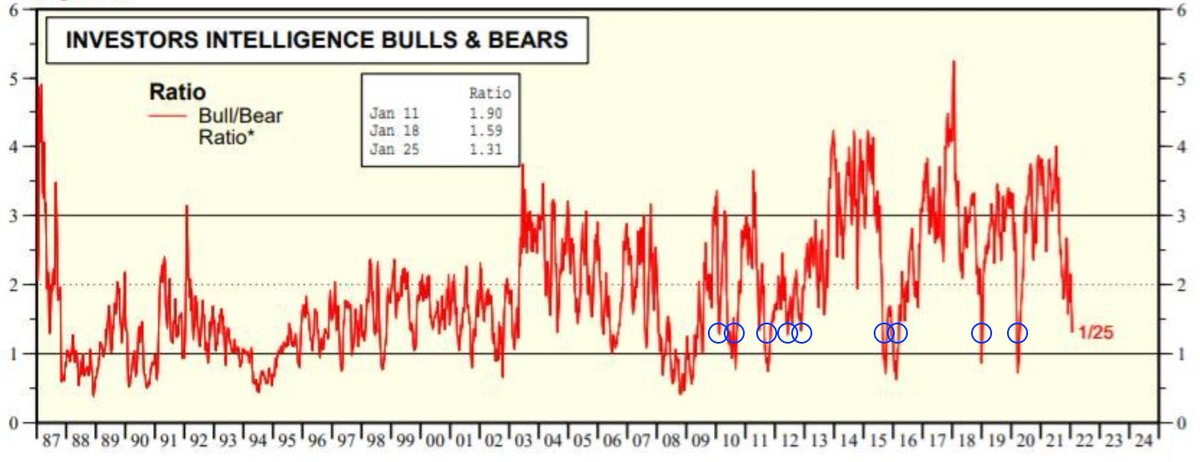
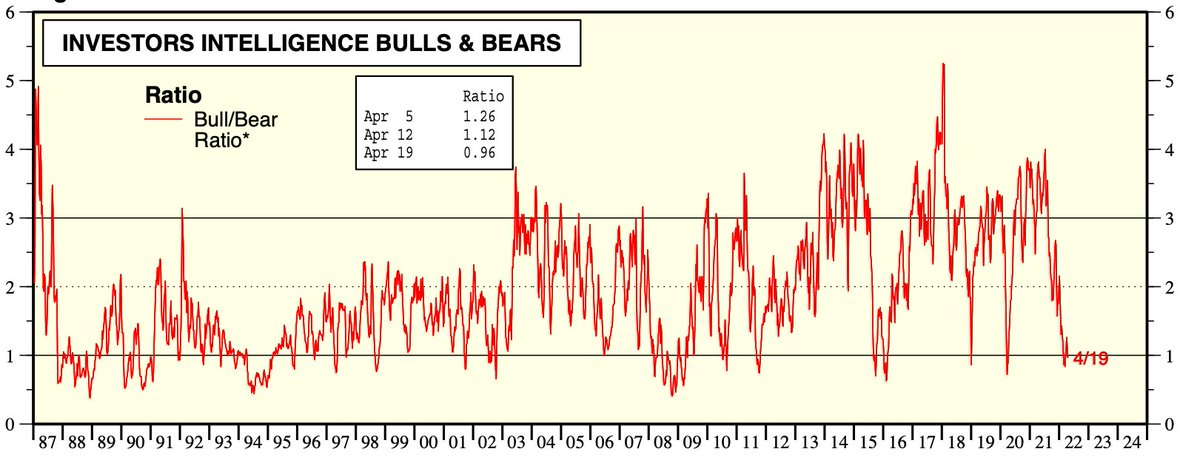
II bull/bear ratio neutral. $SPX hasn’t taken a big tumble without this ratio > 3 in more than 20 years (circles). Note, it can stay on the boil for quite some time

Those circles are drops of >10% on a closing basis btw
5-d $cpce back at the red line today. Same comments apply
https://twitter.com/ukarlewitz/status/1471849675833544705
Retail sentiment (i.e., FinTwit) most bearish since July 2020. Unless it's the GFC, this is near where the lows in $SPX have formed.

(This week was -26 but I posted the chart before stockcharts had updated their data)
“Minus 67.2%, which means that the average Nasdaq-focused stock market timer is recommending that clients allocate two-thirds of their equity trading portfolios to going short. That’s an extremely aggressive bearish posture"
https://twitter.com/MacroCharts/status/1484495998864920578
Lowest AAII bull-bear spread since July 2010 (April 2013 was a bad print). 4-wk avg lowest since Sept 2020

For completeness, here’s Investor Intelligence bull/bear ratio, which dropped to 1.3x this week (LHS). Post-GFC, sometimes it stops here, sometimes in falls <1x; regardless, this is the low end of the range where $SPX has been near a bottom (RHS). Consistent with other data

In the past 35 yrs, the only times AAII (retail) sentiment got more bearish and $SPX failed to rally was during the 1990 and 2008 recessions

Current sentiment

II bulls-bears chart from Tom McClellan (annotations mine). Near a low in $SPX unless its a GFC

Fear & Greed dropped under 20 today (18) for the first time this year. Tweet below from the start of the December rally, fwiw
https://twitter.com/ukarlewitz/status/1466208790907273216
Current sentiment: there’s a 10% chance of civilian-ending global nuclear war
https://twitter.com/RobinWigg/status/1500059906568826882
Per BAML, fund mgr cash basically at a 20-yr high and macro optimism at nearly a 30-yr low
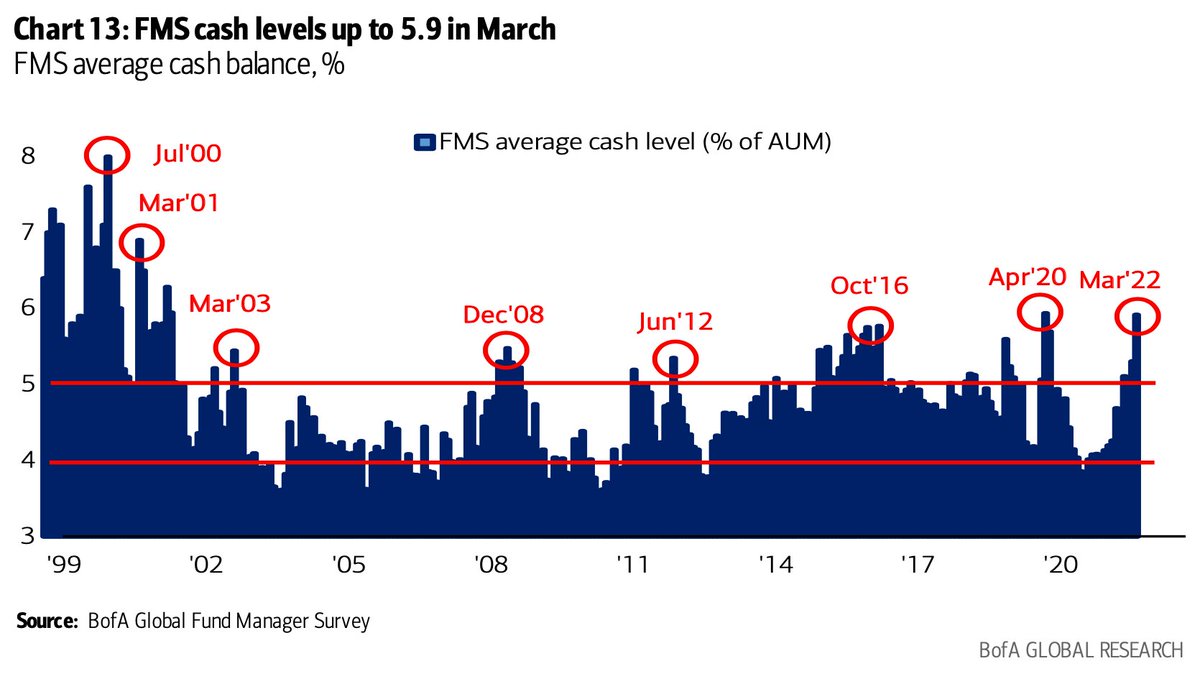

AAII, II, BAML, F&G all very consistent
https://twitter.com/hmeisler/status/1504412236055465988
The 2-12 month forward win rate and returns are way above ‘anytime’
https://twitter.com/sentimentrader/status/1494300924604526595
Current sentiment: prepare for a recession and bear market

$SPX +8% since II bulls-bears turned negative in late Feb. That’s how this works
https://twitter.com/schaeffers/status/1509168498957856773

The other 3 coincided with recessions
https://twitter.com/MikeZaccardi/status/1509529453344407555
TLDR: smart money has gotten very bullish at $SPX lows
https://twitter.com/sentimentrader/status/1509987549024067595
Current sentiment: recession is coming

Retail investors
https://twitter.com/MikeZaccardi/status/1512049252939276291
By 2008, UE, YC, LEI and home sales had all long since rolled over, so a repeat of that exception now is very unlikely.

BAML fund mangers:
1. Commodity overweight most ever
2. Cash overweight 2 std dev > mean
3. Equity underweight 1 std dev < mean
4. Bond underweight 1 std dev < mean
Is it surprising they are hiding out in healthcare, utilities and staples?
1. Commodity overweight most ever
2. Cash overweight 2 std dev > mean
3. Equity underweight 1 std dev < mean
4. Bond underweight 1 std dev < mean
Is it surprising they are hiding out in healthcare, utilities and staples?

FinTwit I mean AAII sentiment still in the drink, like BAML and Investors Intelligence
https://twitter.com/sentimentrader/status/1514559594688925706
$9.6b MF + ETF equity outflow in the past week. Big, but not ginormous. Surprisingly, this is the 2nd largest outflow since Jan 2021. They’re voting with their feet
https://twitter.com/ukarlewitz/status/1443668818321018925
No FinTwitter should be surprised by the continued bearishness of AAII (retail). Consistent with II (charts below), BAML and fund flows (scroll up). All the bloggers on StockCharts are bears and recession chatter is non-stop despite the contrary evidence. All very consistent

Prior charts from Ed Yardeni.
yardeni.com/pub/peacockbul…
yardeni.com/pub/peacockbul…
Last 35 yrs of AAII 4-wk spread vs $SPX

$14.7b MF + ETF equity outflow in the past week, the largest since late Sep 2020. Not a random date; check the chart
Last two weeks: $24b outflow (Lipper)
Last two weeks: $24b outflow (Lipper)
https://twitter.com/ukarlewitz/status/1309192707328286720
• • •
Missing some Tweet in this thread? You can try to
force a refresh


