Urban Carmel Profile picture
Wharton. McKinsey. UBS. Securities industry since '94. Asia ex-pat in '80s-90s. Elected to Mill Valley City Council in '20. Blocked by Zero Hedge since 2010.
RationalInvestor Profile picture Paul Profile picture Louis Winthorpe III Profile picture John S Ohmer Profile picture pk Profile picture 7 subscribed
Mar 3 13 tweets 4 min read
What current trend and momentum have historically implied for the year ahead. A short thread

Up 4 months in a row from November-February: 100% higher at YE by median 13%. Risk/reward 10:1 positive next 12-mo
Up January and February: higher by 20% for the full-year, implying ~12% upside from here
Feb 7 9 tweets 3 min read
FinTwit is losing its mind over the breadth divergence. A thread
$SPX is up 6% since the current divergence started two months ago. That's not unusual at all
Jan 4 4 tweets 2 min read
Unemployment claims (4-wk avg) dropped to 208k, one of the lowest levels in 50 yrs
Today’s NFP was +216k. December 2020 is still the one and only time it was under 100k since the start of the pandemic
Jan 3 7 tweets 3 min read
What to expect in an election year? Based on the averages:
1. Chop/flat through April
2. May swoon
3. June-August summer ramp
4. Flat Sept-Oct
5. Post election ramp into year-end
But, if there's an incumbent:
1. Jan-Feb ramp
2. Chop/flat March-June
3. July-September ramp
4. Flat Oct
5. Post election ramp into year-end
Feb 20, 2023 5 tweets 2 min read
This sounds bad until you realize that the change in "global M2 liquidity" doesn't correlate with the performance of $SPX (1/2) Green circles: "global M2 liquidity" falls and $SPX rises anyway (2/2) Image
Jan 10, 2023 10 tweets 3 min read
TDA clients net sellers in December (green line). Sentiment about as low as it has gotten in the past 13 years Which is consistent with fund managers polled by BAML in December. Extremely high cash and low allocation to equities
Jan 5, 2023 15 tweets 6 min read
“And maybe I’m in a good position of knowing the limitations, given that it’s my model.” At least two reasons given.

First, "real" 10-3 (the actual basis for the model) has not inverted. This matters because further out inflation expectations are easing, lowering the recession risk. Here's real 10-1 as an example
Jan 4, 2023 17 tweets 6 min read
I think this (from late March 2021) is useful context for understanding the current market. $SPX today is where it was 21 months ago
Updated chart. Rapid advances have led to consolidation. This one kept going higher another 9 mo so a longer/deeper consolidation isn't a surprise. Image
Jan 4, 2023 8 tweets 3 min read
Every rally in the past yr has stopped when $NYHL (10-dma) has gotten back to neutral (bottom panel). It'll be a useful confirmation of a new uptrend when it backs/stays above 0 Image 
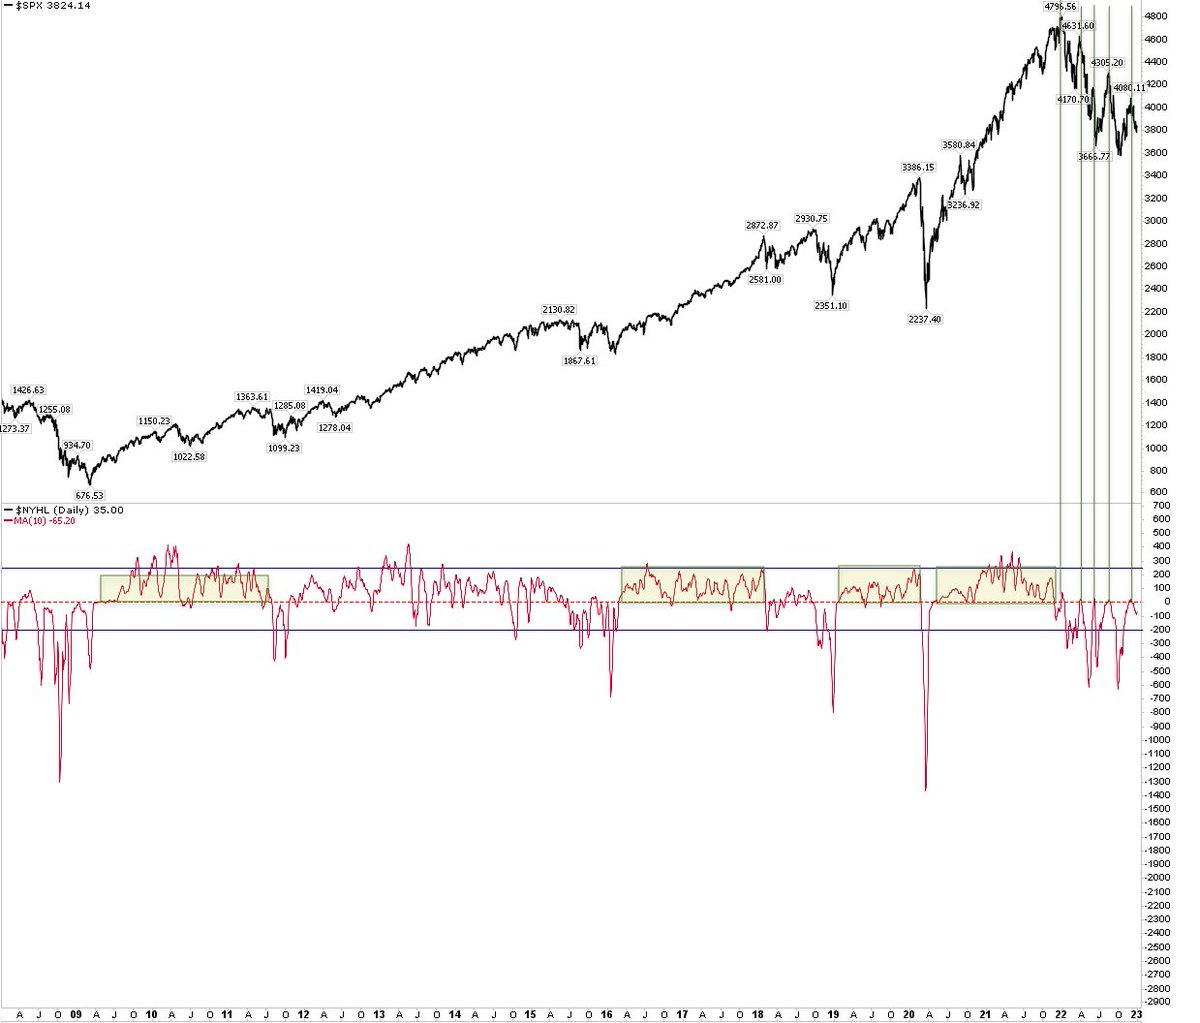
$NYHL (10-d) reached 42 Thursday.

Likewise, this:
Jan 3, 2023 18 tweets 5 min read
At its closing low, $SPX fell 25.5% in 2022. Almost all of that (93%) happened by mid-June. Since then, more sideways than down (i.e., a possible base). 4100 then 4300 key upside Image In contrast, $NDX has broken its mid-June low 3 times and starts 2023 below. If you think it needs to lead, then the time is now Image
Jul 15, 2022 23 tweets 7 min read
Up volume 87% today, one of the best of the year (upper panel). The next day hasn't generally seen follow through (lower panel). It'll be a good sign if that changes Image
Jul 8, 2022 10 tweets 3 min read
The low - at least so far - for both $SPX and $NDX was June 16. Here are a few charts from that day 1/n
2/n
Jul 6, 2022 5 tweets 3 min read
$NDX up 3 days in a row. It hasn't been up 4 days since March and only twice in 2022. 4-5 days in a row common in 2021. It's a good sign of sustained buying interest Image Set up for NFP day with $NDX and $SPX up 4 in a row ImageImageImageImage
Jun 6, 2022 6 tweets 2 min read
98% of $SPX has reported 1Q earnings. Sales up +14% yoy and +12% higher than pre-pandemic (4Q19) Margins 11.9% (virtually the same ex-energy) down from 13.4% in 4Q but up from 10.1% pre-pandemic
Apr 30, 2022 4 tweets 1 min read
Peeps losing their minds in my TL with the avg stock down all of 9% are either atrocious stock pickers or joined the world of finance in the Robinhood era Reminder
Apr 27, 2022 6 tweets 2 min read
Other times $SPX has fallen >13% without it becoming a nasty bear market Image YTD, the avg stock in $SPX is down 8% Image
Apr 26, 2022 4 tweets 2 min read
This is recency bias, and it’s the main reason investors underperform
Everyone loved small caps heading into 2021. They underperfromed large caps by 50% that year
Apr 14, 2022 6 tweets 3 min read
Mortgage rates are up (first chart) and home prices have been in a long rising trend (2nd chart) but so has disposable income (3rd chart), which means that mortgage debt serving is…not a big problem ImageImageImageImage Nor are financial obligations (debt service plus rent and lease payments) Image
Mar 22, 2022 12 tweets 5 min read
Russia invaded Ukraine a month ago (Feb 24). +10% since then ImageImageImage 
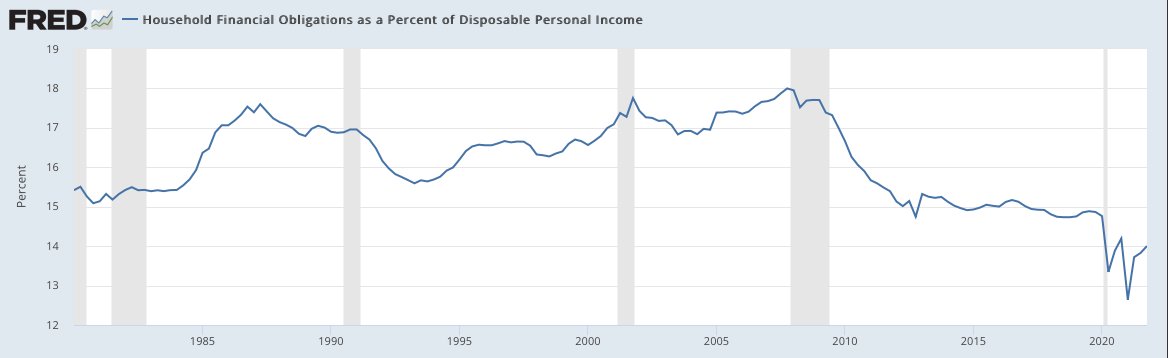
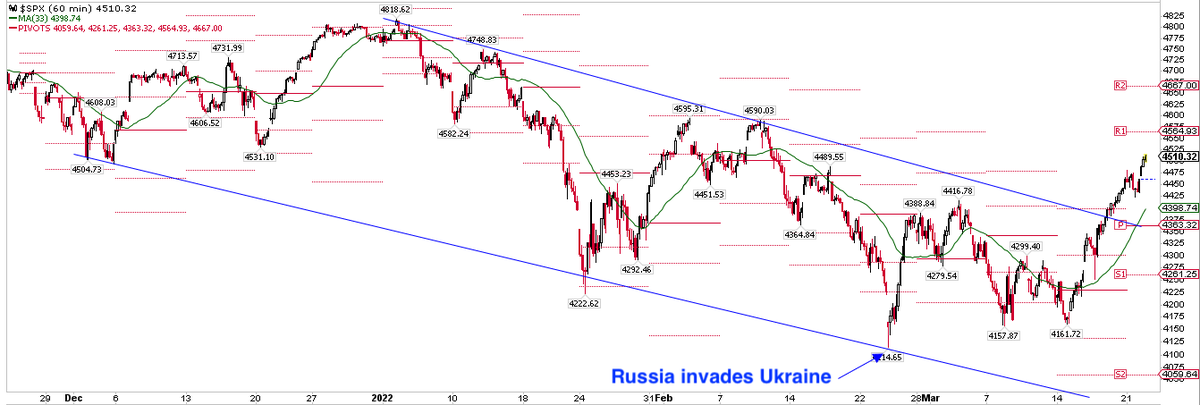
Now less than 1% from a 62% retracement for both $SPX and $RUA ImageImage
Mar 17, 2022 16 tweets 4 min read
Breadth: $NYMO +57 is the highest since November 2020.

LHS: the last 12 yrs (first signal) when $SPX has fallen >10%.

RHS: +80 in bruising bear market is rare but happened in late ’08. It’ll be a good sign if $NYMO climbs to +80 in the days ahead ImageImage All the losers (red 12-mo later) were during recessions.
Dec 30, 2021 19 tweets 5 min read
Only 3 of the 9 $SPX sectors outperformed this year, led (by far) by energy. If you think that a market led by just 3 of 9 sectors is weirdly narrow, you’re wrong. In 2020, only 2 sectors outperformed and in 2019 only 1 sector outperformed. That’s how this works