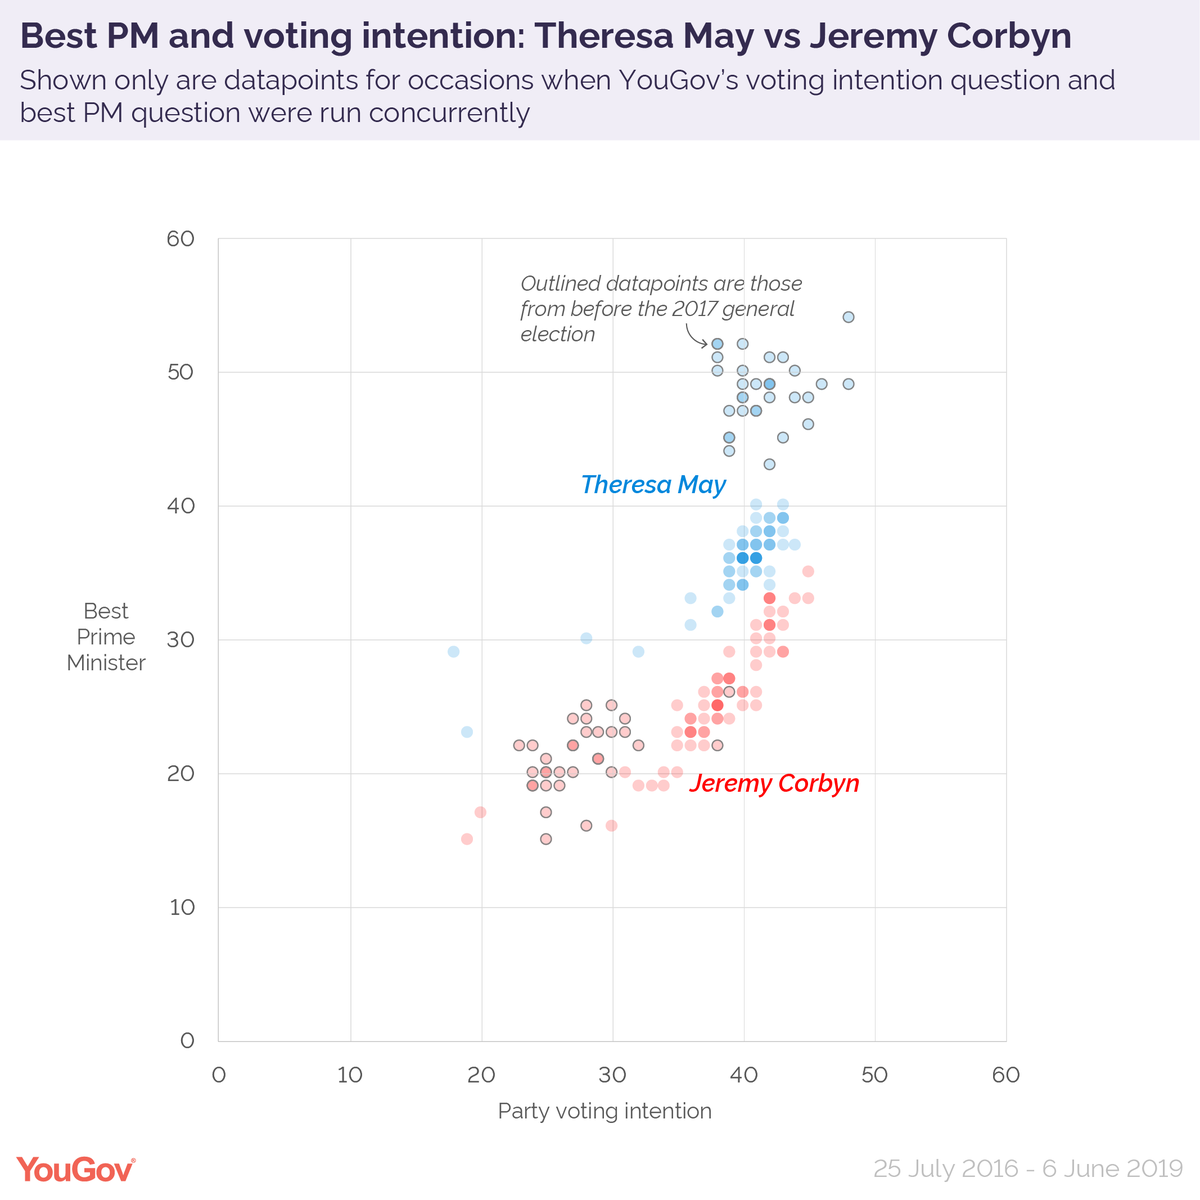
We’ve taken a look back over the last 10 years of voting intention and best PM data for @timesredbox. Here are some of the top tidbits from the last decade #thisisnotnormal
However, chaos with E̵d̵ ̵M̵i̵l̵i̵b̵a̵n̵d̵ Theresa May then ensued…
Best PM rating:
May, pre GE2017 – highest 54% / lowest 43%
May, post GE2017 – highest 40% / lowest 23%
Corbyn, pre GE2017 – highest 32% / lowest 13%
Corbyn, post GE2017 – highest 39% / lowest 15%
It’s hard to remember that just over a year ago the Brexit Party and the Lib Dems had both led our Westminster voting intention polls, relegating the Tories and Labour into third place #thisisnotnormal
About a year ago also saw “don’t know” score its highest ever total in the best PM question – 55%. The candidate of uncertainty has won the contest 114 out of 237 times over the past decade
The coronavirus crisis has severely knocked Boris Johnson’s ratings, and Keir Starmer is now fast closing the gap
Best PM rating, 17 Apr/19 May/30 May:
Johnson – 46%, 39%, 37% ↘️↘️↘️
Starmer – 22%, 27%, 32% ↗️↗️↗️
• • •
Missing some Tweet in this thread? You can try to
force a refresh
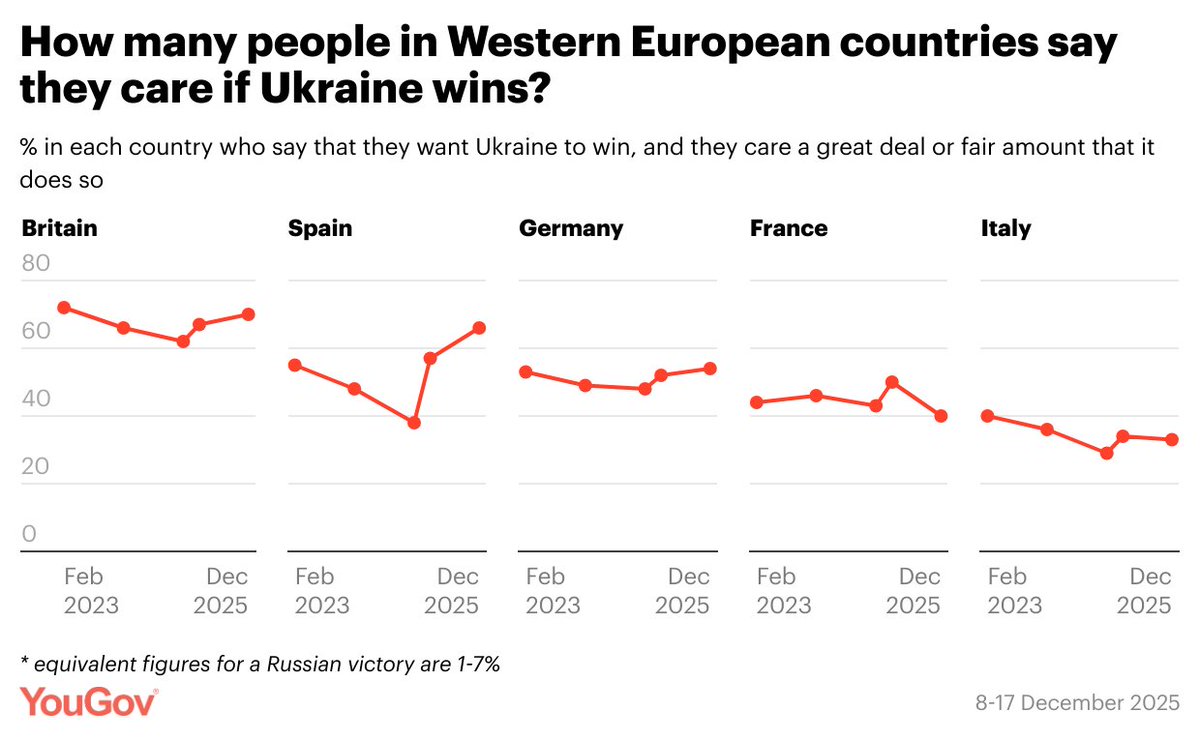
While Western Europeans are much more likely to want Ukraine to win than Russia, the number who do so AND care a great/fair amount about it has fallen noticeably in some countries since early 2023
With Donald Trump due to become president again in January, Western Europeans typically expect that he will end support to Ukraine – although they are less sure whether he will follow through on threats to withdraw from NATO
Negative attitudes towards Labour have not crystallised just yet. Most Britons (54%) still say they are willing to give the new government the benefit of the doubt
Have high hopes, think they will do well: 19% (-2 from 20 Jun)
Do not have high hopes, but give benefit of doubt: 35% (=)
Do not have high hopes, think they will do badly: 38% (+5)
Nevertheless, many Britons feel let down by Labour. 23% say they expected them to do well in government, but have been disappointed so far
Expected to be bad, and they have: 39%
Expected to be good, but have been disappointed: 23%
Expected to be bad, but have been better than expected: 3%
Expected to be good, and they have: 11%
25 years after devolution for Scotland, and 10 years after the independence referendum, what constitutional set-up do Scots support having?
Devolution, more powers: 51% support
Devolution, current powers: 46%
Autonomy within UK: 42%
Full independence: 41%
Abolition of devolution: 21%
Devolution, fewer powers: 19%
In Wales, existing or enhanced devolution are also the most popular options, though 31% would support abolishing devolution
Devolution, more powers: 40% support
Devolution, current powers: 39%
Autonomy within UK: 32%
Abolition of devolution: 31%
Full independence: 24%
Devolution, fewer powers: 23%
With the 10 year anniversary of the Scottish independence referendum tomorrow, support for 'Yes' and 'No' among voters stands at effectively the same level as a decade ago
'Yes' voters are more likely to have changed their minds since 2014, but are being replenished by younger voters who lean towards Scottish independence
Two-thirds of Conservative members want to be able to vote on policy at conference and be able to vote on all leadership candidates, with six in ten also wanting to elect a deputy leader
While Britons generally think the police have handled the riots well, they lack confidence in their ability to protect people and property from further unrest
A lot/some confidence: 38%
Not a lot/no confidence: 58%