 Net support for backing Ukraine until victory (+) vs a negotiated peace (-)
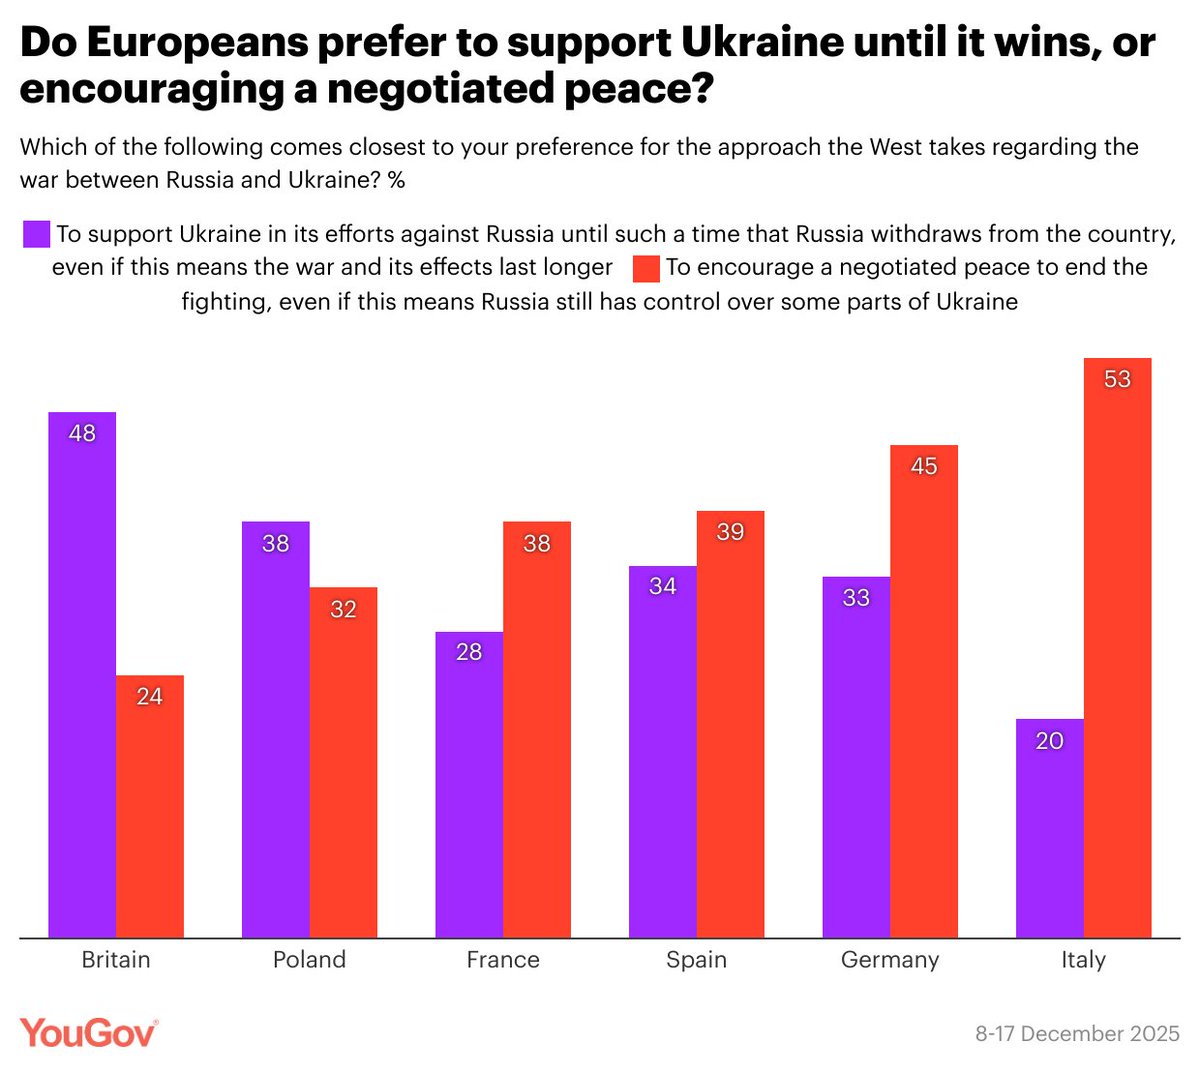
 Scottish people tend to feel that key public services in their area are in a good state
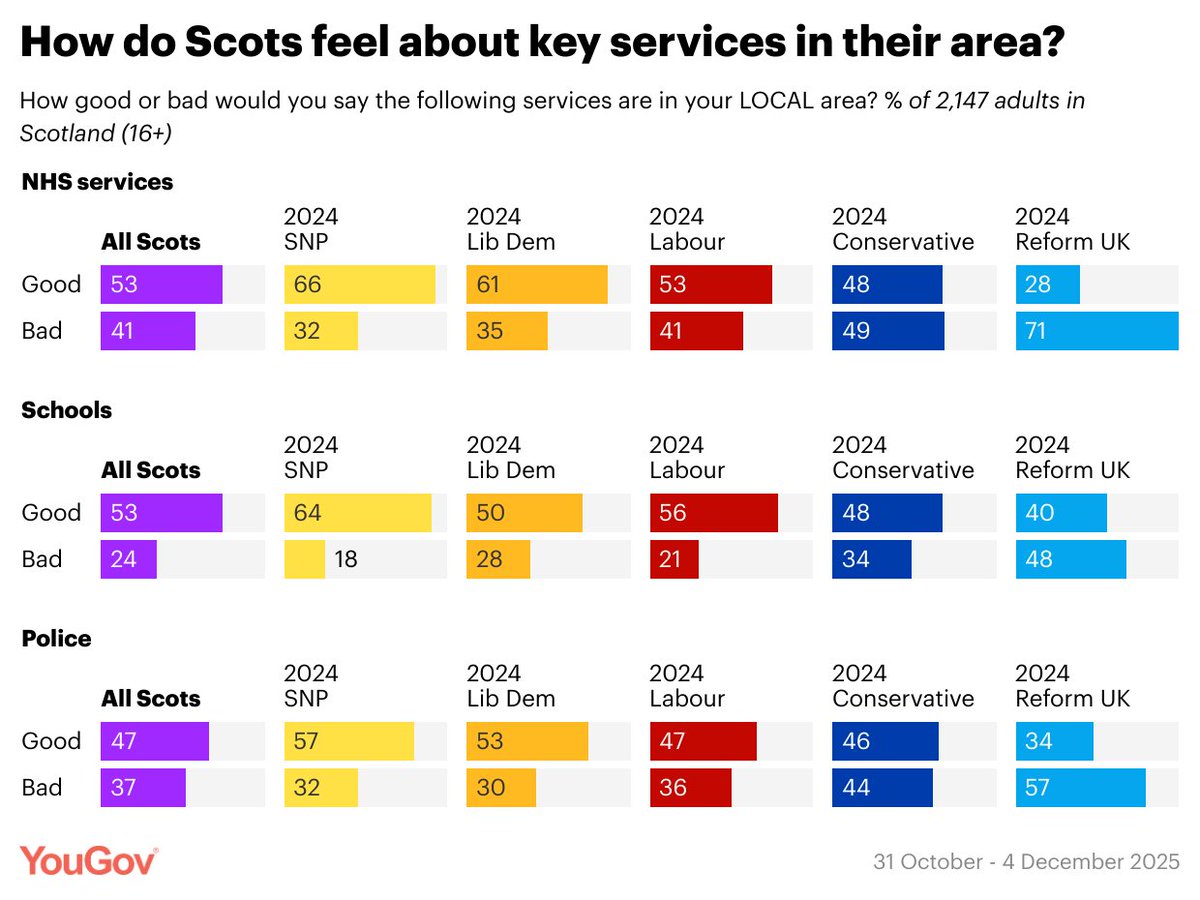
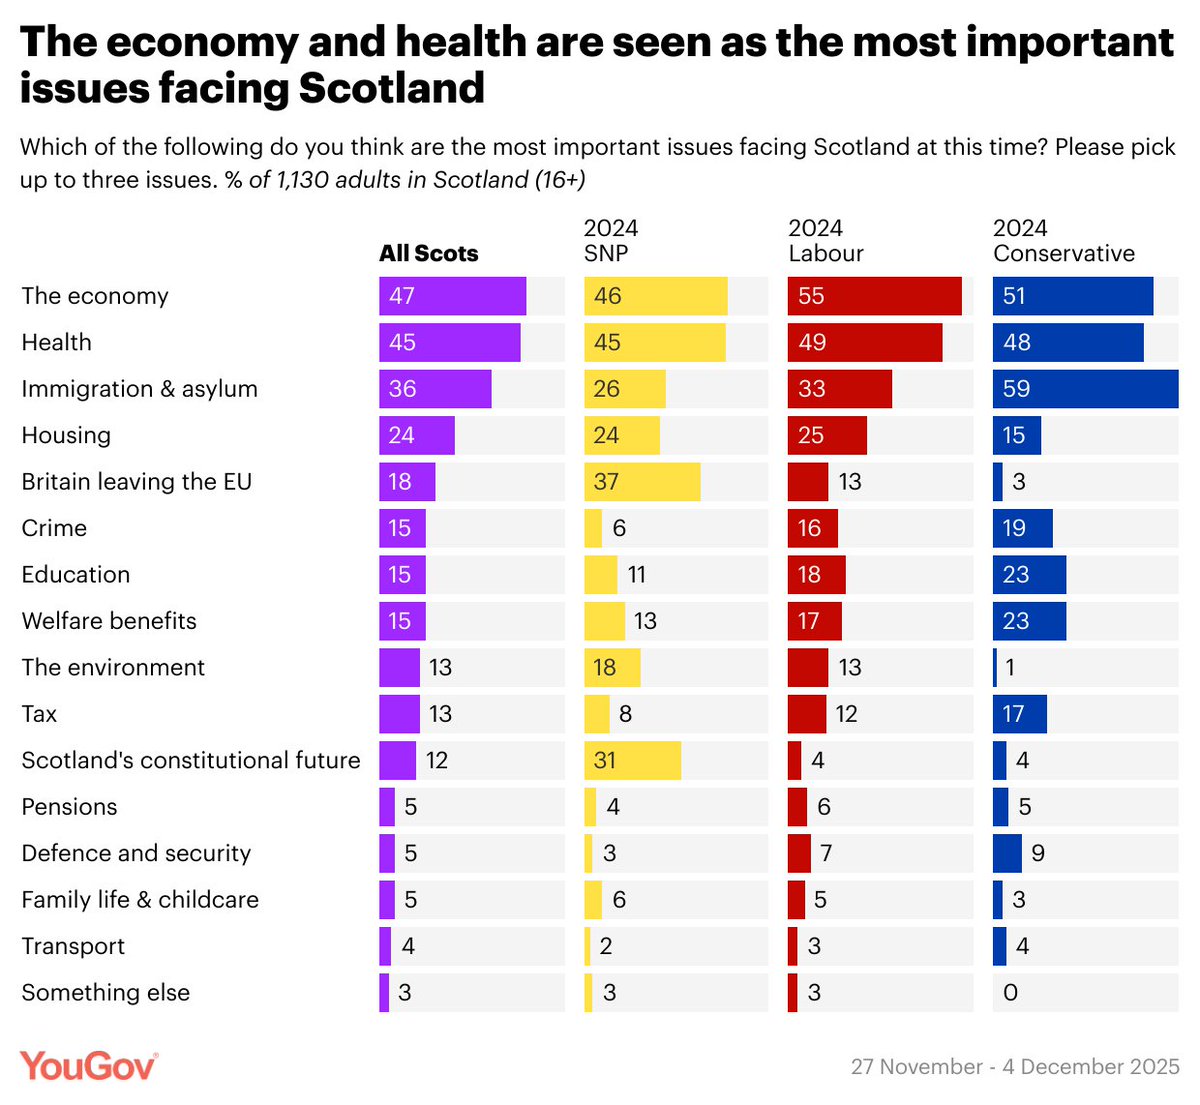 What do Scottish voters see as the top issues facing Scotland?
 Ethnic minority adults in England who were born in the UK are more likely than their white counterparts to say they feel a greater British than English identity
 Labour's net favourability rating, by ethnicity
 Just 32% of those who would consider voting for a Corbyn-led party say it is the party they are most likely to consider voting for, including only 9% saying it is the only party they would consider voting for (of the main national parties)
 Compared to those sticking with the party, Conservative defectors to Reform UK are more likely to be men (58% vs 44%), more likely to have voted Leave (80% vs 61%) and are older (83% are over 50 vs 75%)
 Most Western Europeans see Donald Trump as a big threat to peace and security in Europe
 Following the recent row with Donald Trump in the Oval Office, Ukrainian president Volodymyr Zelenskyy's reputation has improved in the UK
 % saying immigration is one of the two top issues facing their country
 On transgender social/legal status, % of Britons think...
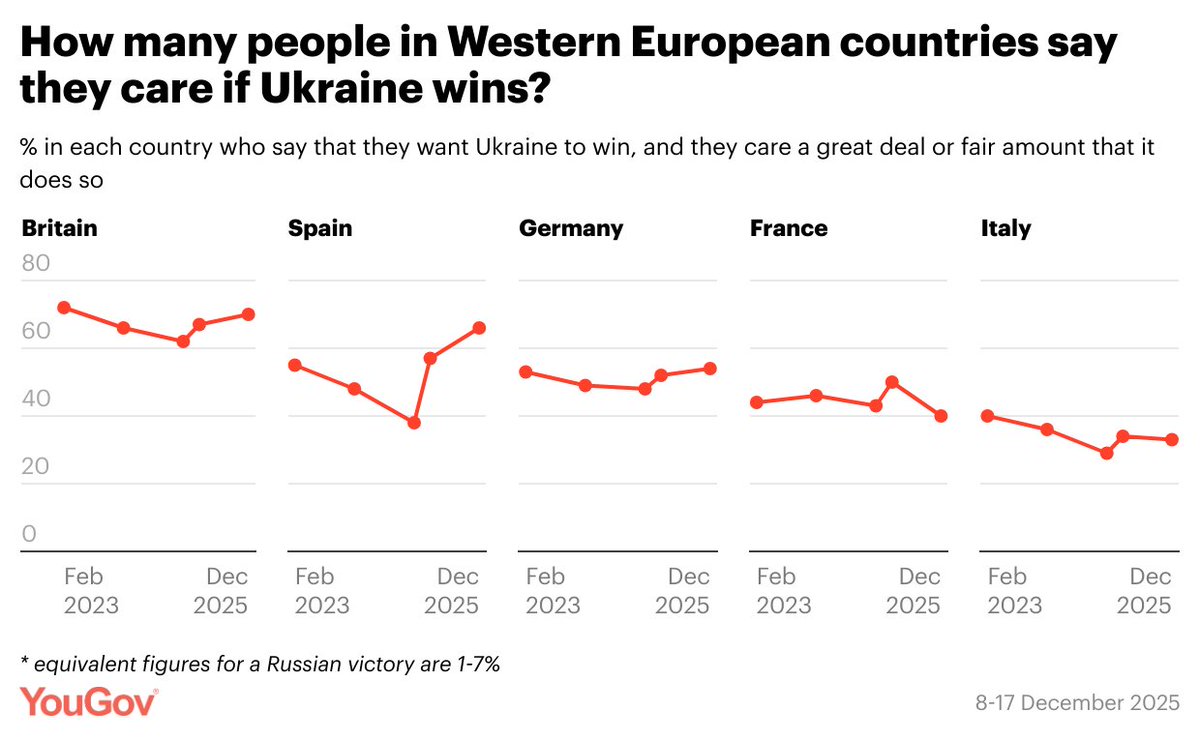
 While Western Europeans are much more likely to want Ukraine to win than Russia, the number who do so AND care a great/fair amount about it has fallen noticeably in some countries since early 2023
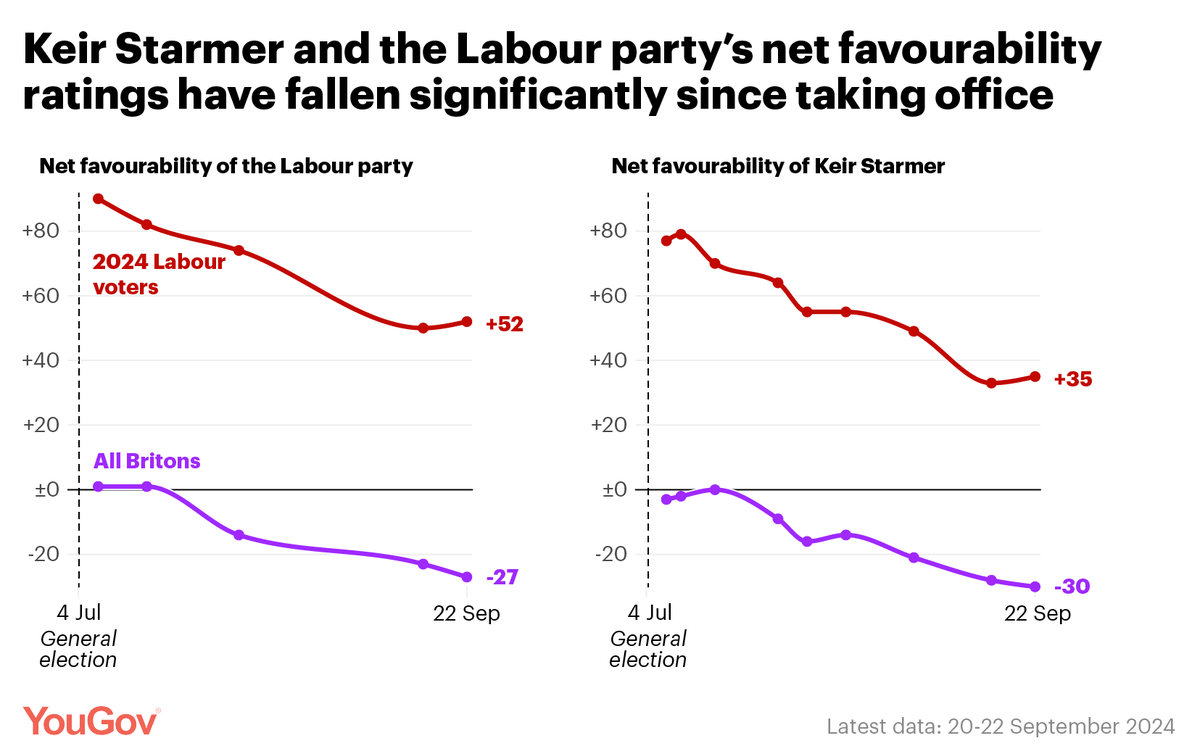 Negative attitudes towards Labour have not crystallised just yet. Most Britons (54%) still say they are willing to give the new government the benefit of the doubt
 Which constitutional set-ups for Scotland are popular with the different parties?
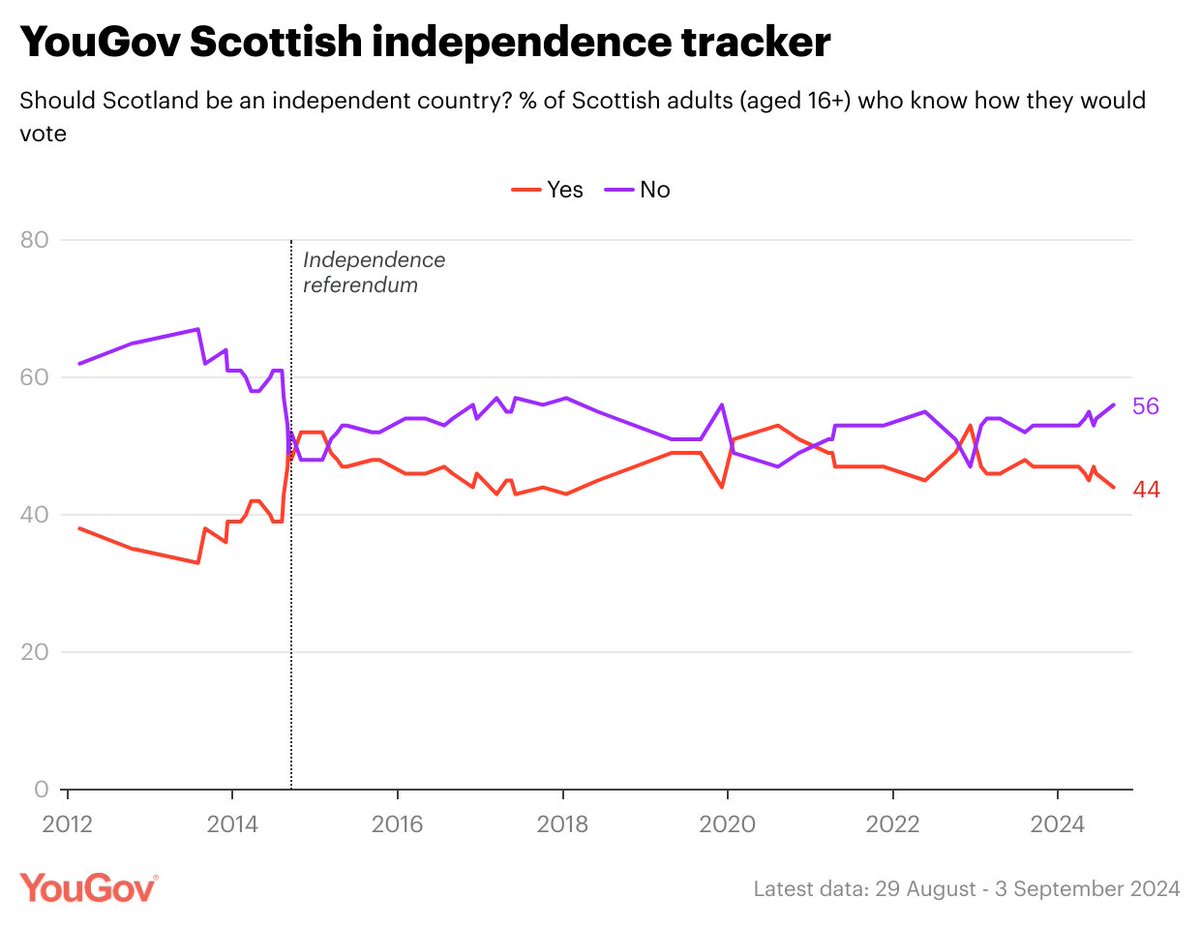 But 'No' supporters are less likely to say their view on Scottish independence is strongly held
 Nonetheless, most Conservative members feel the party should move to the right and primarily target Reform UK voters over the next parliament
 52% of Britons think the police are handling the recent riots well
 Reform UK voters are the most likely to have positive opinions of the riots and rioters, although this is still a minority view among these voters
 Overall, fewer than one in five Britons are consistently right-wing in their party preferences, i.e. rank the Conservatives and Reform UK ahead of every other party, compared to 40% who rank all major progressive parties ahead of them.
 Age continues to be a key factor in how Britons vote, with younger adults mostly backing left wing parties and older adults tending to vote for right wing parties.
 Our final call vote share, based on our MRP, is...
