We’ve taken a look back over the last 10 years of voting intention and best PM data for @timesredbox. Here are some of the top tidbits from the last decade #thisisnotnormal
thetimes.co.uk/article/covid-…
thetimes.co.uk/article/covid-…

The Cameron vs Miliband era seems like a beacon of stability compared to what followed.
Best PM rating:
Cameron – highest 41% / lowest 30%
Miliband – highest 28% / lowest 16%
Best PM rating:
Cameron – highest 41% / lowest 30%
Miliband – highest 28% / lowest 16%

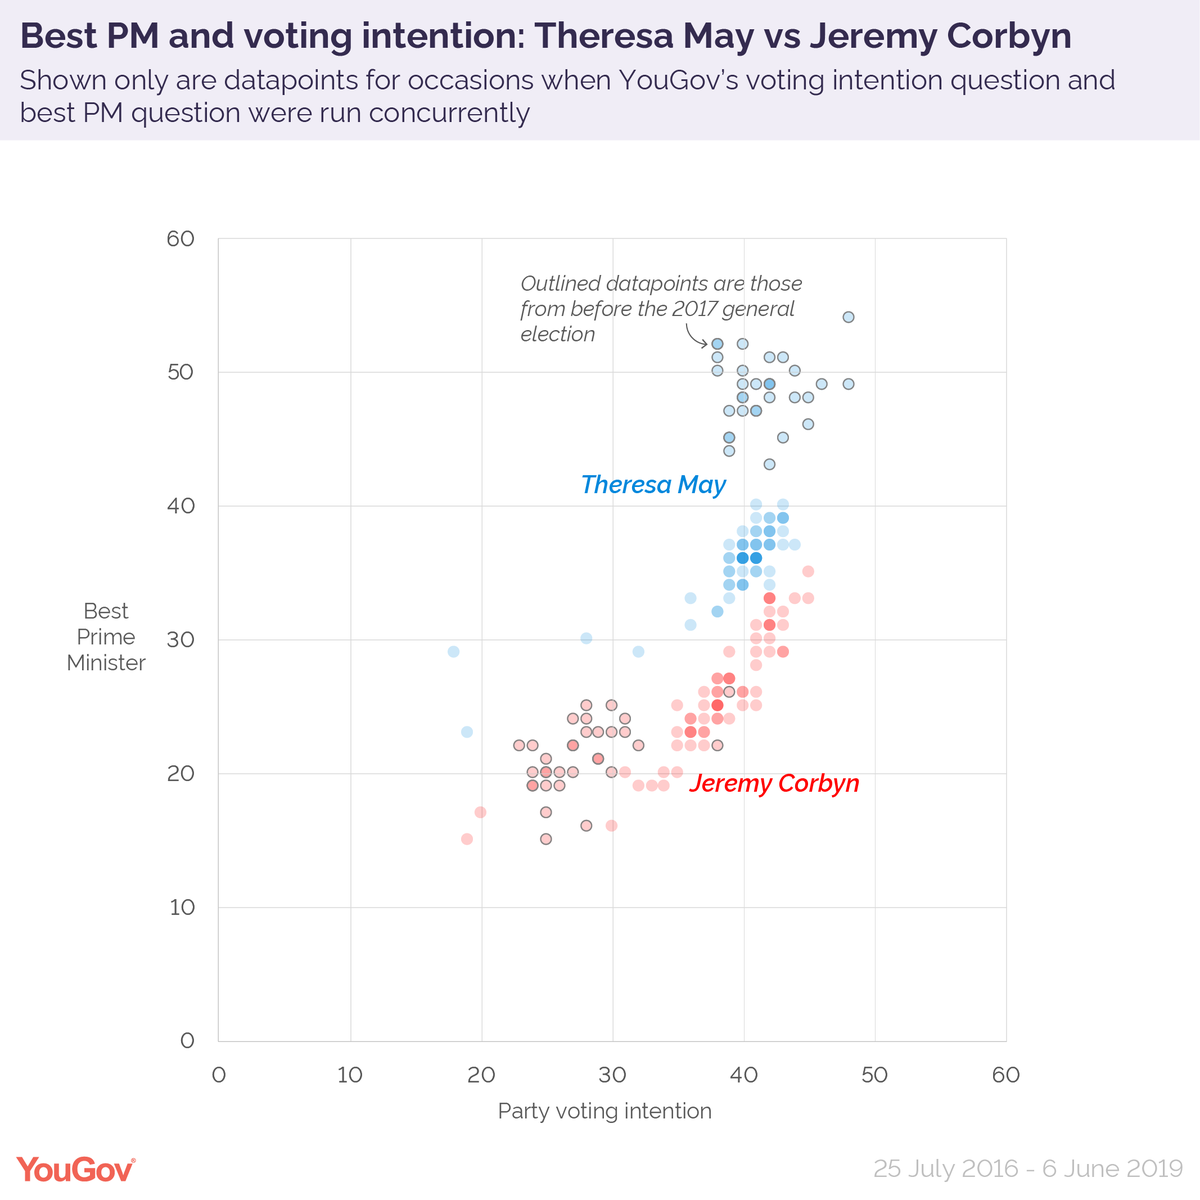
However, chaos with E̵d̵ ̵M̵i̵l̵i̵b̵a̵n̵d̵ Theresa May then ensued…
Best PM rating:
May, pre GE2017 – highest 54% / lowest 43%
May, post GE2017 – highest 40% / lowest 23%
Corbyn, pre GE2017 – highest 32% / lowest 13%
Corbyn, post GE2017 – highest 39% / lowest 15%
Best PM rating:
May, pre GE2017 – highest 54% / lowest 43%
May, post GE2017 – highest 40% / lowest 23%
Corbyn, pre GE2017 – highest 32% / lowest 13%
Corbyn, post GE2017 – highest 39% / lowest 15%
It’s hard to remember that just over a year ago the Brexit Party and the Lib Dems had both led our Westminster voting intention polls, relegating the Tories and Labour into third place #thisisnotnormal

About a year ago also saw “don’t know” score its highest ever total in the best PM question – 55%. The candidate of uncertainty has won the contest 114 out of 237 times over the past decade

The coronavirus crisis has severely knocked Boris Johnson’s ratings, and Keir Starmer is now fast closing the gap
Best PM rating, 17 Apr/19 May/30 May:
Johnson – 46%, 39%, 37% ↘️↘️↘️
Starmer – 22%, 27%, 32% ↗️↗️↗️
Best PM rating, 17 Apr/19 May/30 May:
Johnson – 46%, 39%, 37% ↘️↘️↘️
Starmer – 22%, 27%, 32% ↗️↗️↗️

• • •
Missing some Tweet in this thread? You can try to
force a refresh