t.me/learnwhy
#TradersClub #ESCORTS ##StockAnalysis

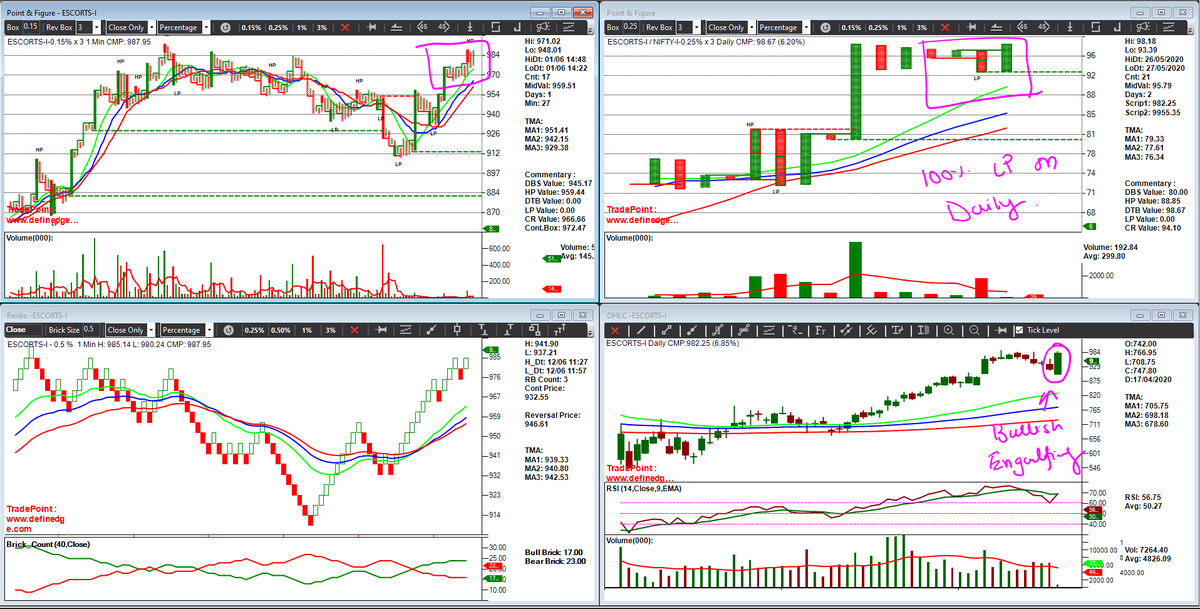
1. Bullish Engulfing candle on Daily timeframe
2. Eight-day price loss recovered in a day
1. On the daily timeframe, the formation of 100% Low Pole + DTB on HP. The bullish formation we can trust
2. On 0.15% x 3; 1-min timeframe, presence of Anchor follow-through + Probable DTB (988.7) on HP
3. Open Vertical counts on 1-min charts are 999 and 1006
1. ESCORTS is trading above TMA
2. TMA is properly aligned for a bullish run
1. On the daily timeframe, the formation of 100% Low pole
2. On 0.15% x 3; 1-min timeframe, the script is trading above TMA
3. TMA is properly aligned for bullish run
As per P&F Matrix, Performance score is 8 and Ranking Score is 82.5. Setup is bullish on 1% box-size.
As per RS Matrix, Performance Score is 4 and Ranking Score is 36.25. On 2% box size score is 1 and 3% score is 2. Good buy for intraday trade.
As per charts, ESCORTS looks bullish and can be traded for a target of 1006; entry at 988.7 with SL at 973. RR is (Reward:17/Risk:16) 1.06. SL should be trailed once the stock moves in the bullish direction to ensure capital is intact as RR is only 1.


