Passionate Educator | Sharing insights on Trading & Financial Markets | Former Dean & Professor
Views are personal. Nothing here is advice.
5 subscribers
Jan 29, 2023 • 36 tweets • 8 min read
Follow this thread for a step-by-step guide on how to calculate, interpret, and apply ADX to both OHLC and PnF charts. Plus, discover how to use ADX for indicative scans. #ADX#TechnicalAnalysis#Trading
This thread includes a study of Welles Wilder from his book ‘New Concepts in Technical Trading System’ on the Average Directional Index (ADX). This book also includes details on Average True Range (ATR), the Parabolic SAR system, and RSI.
2/
Dec 11, 2022 • 18 tweets • 6 min read
Thread 🧵⬇️
We will delve into the use of Options Chain analysis as a tool for gaining insights into the market's direction.
We will touch on two concepts - Max Pain and PCR, and how to apply this information to your trading decisions. #OptionsOpenInterest#MarketAnalysis
In this thread, we are going to discuss which tools to use to analyze OI, how to interpret the data and some case studies.
2/18
Dec 4, 2022 • 24 tweets • 5 min read
Thread 🧵⬇️
Open Interest and how to effectively use open interest for our analysis
1/22
Let us start with understanding what is Open Interest and why traders are obsessed with OI data. What information we can fetch from the data and why analysing it is important?
2/22
Nov 12, 2022 • 18 tweets • 6 min read
“If you are in the right sector at the right time, you can make a lot of money real fast.” – Peter Lynch
In this thread, 🧵⬇️
- we will discuss sector rotation
- how we can spot that with help of @mystockedge
1/17
Sector rotation is the movement of money invested in stocks from one industry to another as investors and traders anticipate the next stage of the economic cycle.
2/17
Sep 30, 2022 • 20 tweets • 4 min read
Thread-6 | Pole - High Pole 🧵⬇️
In this thread we will discuss: 1. Pattern construction 2. High Pole 3. How to trade High Pole
1/20
Pattern Rules (three requirements) 1. Breakout – DTB or DBS 2. Long Column 3. Price retracing at least 50%
All happening over 4 Columns
2/20
Sep 27, 2022 • 14 tweets • 5 min read
Thread-5 | Traps Pattern
In this thread we will discuss: 1. Traps 2. Importance of Traps 3. Types of Traps patterns 4. Bear Traps 5. Bull Trap
1/14
Traps is getting stuck in a trade that has moved against the entry
2/14
In this thread we will discuss: 1. What are Multi Column Patterns 2. Importance of this Pattern 3. How to trade this pattern 4. Case Studies and examples
1/17
If you have missed reading Basic Patterns of PnF, I will encourage you to read that first to take the best out of this thread
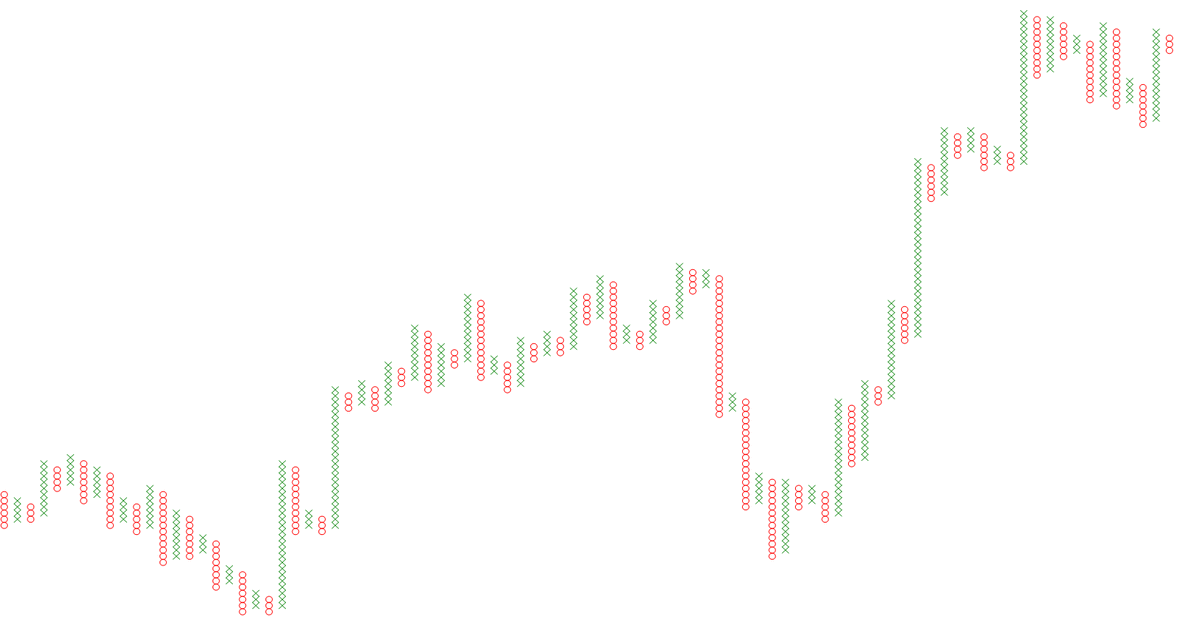
In this thread we will discuss: 1. Box Value into different slots 2. Pattern formation in each slot 3. Importance of patterns in different box values
1/18
Whenever we decide to plot P&F Charts, determining box values is important. Log box values have simplified the subject and made the patterns and other P&F formations more relevant.
2/13
Sep 9, 2022 • 18 tweets • 5 min read
Thread-2 | Basic Patterns of P&F Charts
In this thread we will discuss: 1. Column Reversal 2. Double Top Buy (DTB) 3. Double Bottom Sell (DBS)
1/16
Column Reversal
In the first thread of the Twitter Thread series, we discussed the construction of P&F charts. So, for a quick recap, a shift in column happens in the P&F chart only when reversal criteria is met.
2/16
Sep 6, 2022 • 34 tweets • 8 min read
Thread-1 | Introduction to P&F Charts
In this thread we will discuss: 🧵⬇️ 1. What is a Point & Figure Charts (P&F) 2. Why consider P&F for trading and investing 3. Construction of P&F Charts 4. How P&F method of charting will help you
1/33
What is a P&F?
P&F chart plots price movements for stocks, bonds, commodities, or futures without taking into consideration the passage of time. Contrary to some other types of charts like OHLC, which mark the degree of an asset's movement over set time periods
In the thread⬇️ 1. #Nifty Range and Breadth 2. #Banknifty range and Breadth 3. #Sector Breadth 4. #FII Derivative Activity 5. #Summary of the analysis 1. Price trading above TMA is bullish 2. Broke out of recent consolidation 3. Near resistance is 18000 4. Support is 17500 #Nifty#nifty50#NIFTYFUT
In the document ⬇️ 1. #Nifty Range and Breadth 2. #Banknifty range and Breadth 3. #Sector Breadth 4. #FII Derivative Activity 5. #Summary of the analysis 1. The marked zone in 'Green' is Demand Zone for Nifty 2. Price has traded there for more time than expected near the Demand Zone 3. Price trading near the demand zone is a negative sign and may have weakened the zone
In this thread: 1. How to use MAs as breadth indicator 2. Application and Interpretation 3. How to fetch data – Software and Tools
Concept Thread 🧵⬇️
1/12
Breadth helps to evaluate the market sentiments by measuring the number of stocks above and below particular criteria.
2/12
Jul 16, 2022 • 50 tweets • 7 min read
Breadth Indicator
The most relevant indicator to understand and evaluate market sentiment
In this thread: 1. What is a breadth indicator 2. Different types 3. How to use it
Concept Thread 🧵⬇️
Breadth helps to evaluate the market sentiments by measuring the number of stocks above and below particular criteria.
2/49
Jul 15, 2022 • 11 tweets • 5 min read
Pre-Market Capsule | 15th July
In the thread ⬇️ 1. #Nifty Range for the day 2. Nifty Breadth 3. #Banknifty range for the day 4. Banknifty Breadth 5. #Sector Breadth 6. #Derivative Analytics 7. Summary
1/10 #Nifty on charts
1. Nifty below TMA is bearish 2. Currently near the support zone 3. If Nifty goes below 15860 it will increase the chances of reaching 16670 levels or further below
2/10
Jul 14, 2022 • 12 tweets • 6 min read
Pre-Market Capsule | 14th July
In the thread ⬇️ 1. #Nifty Range for the day 2. Nifty Breadth 3. #Banknifty range for the day 4. Banknifty Breadth 5. #Sector Breadth 6. #Derivative Analytics 7. Summary #Nifty on charts
1. Trading below TMA 2. TMAs are turning negative 3. When TMAs are in the process of becoming negative = #markets generally go sideways 4. Expect sideways to #bearish action
May 29, 2022 • 12 tweets • 6 min read
1/12
Did you try predicting momentum in stock but failed? This thread is for you.
In this tread, we will discuss the concept of Momentum Trading using Relative Strength to identify a perfect trade setup which will have high accuracy and small SL.
Strategy Thread 🧵⬇️
2/12
Relative Strength is a behaviour of stock w.r.t Benchmark or Sector. That means it is a method of identifying stocks or instruments that are relatively strong or weak either against benchmark or sector.
Feb 10, 2022 • 19 tweets • 6 min read
1/19
Have you ever thought of considering #CAGR for your #trading?
If not, this thread will give you a new insight into how CAGR can be used for trading as well as in investing. I have been using this concept for a long time now.
🧵⬇️
2/19
CAGR stands for Compound Annual Growth Rate. This shows - at what rate the stock/index is growing year on year. In my terms, how much wealth it has generated for the investor. I have not come across any other ratio which gives this information.
Dec 19, 2021 • 7 tweets • 6 min read
Master Thread 🧵| Index of all Twitter Threads and YouTube Videos of November and December month
Topics Covered:
Moving Averages (#MA)
Relative Strength Index (#RSI)
Trading #Divergences using RSI
#Trading#Investing#Thread#Learnings
Moving Averages (#MA)
Widely used indicator by traders but with a lesser understanding of what it reflects and how it should be analysed.
In this thread: 1. MA and possible use case to help you make trading decisions 2. Mean-reversion 3. Disparity
In this thread 🧵, we will discuss: 1. What is Divergence 2. Why are they formed 3. Types of Divergences 4. #Trading RSI Divergence
1/n I had discussed #RSI indicator in my last thread.
If you have not read about RSI, I will encourage you to read about that first before learning about Divergence