
This paper on the timing of COVID peak in UK has been getting a bit of coverage, so I think it's worth taking a closer look... arxiv.org/abs/2005.02090 1/ 
The paper is by Simon Wood (who developed mgcv R package). In contrast to studies that constrain transmission decline to when specific measures went in, this paper uses flexible function to try & reconstruct changes in early infections from later deaths (accounting for delays) 2/
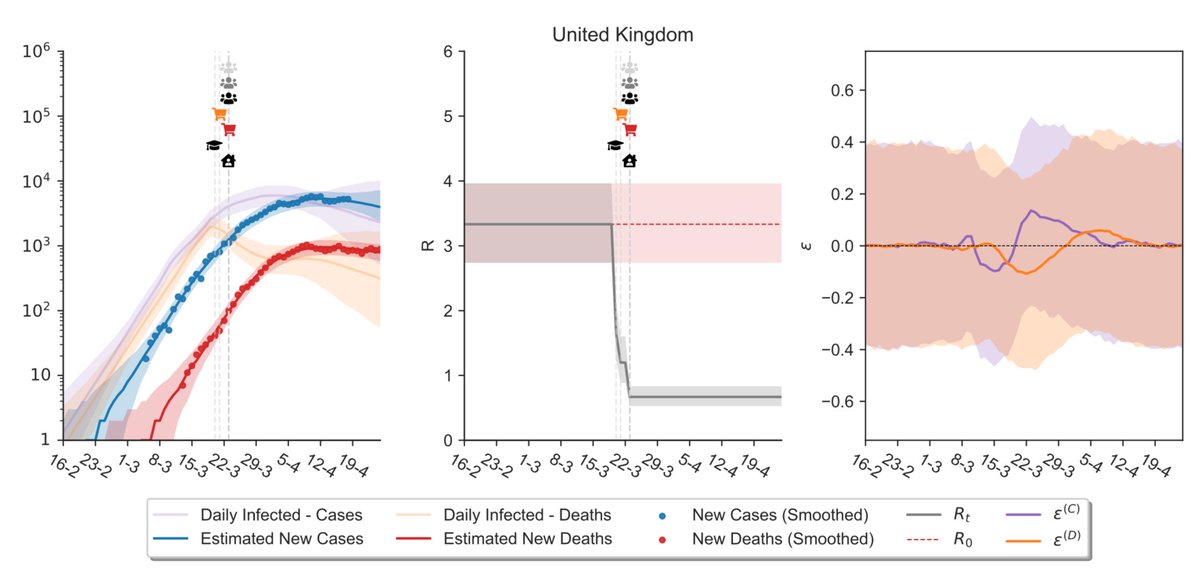
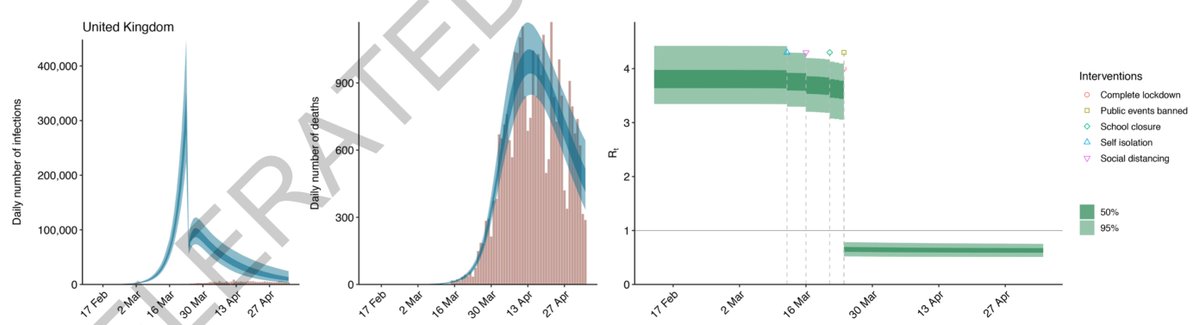
First, as Wood notes, it's extremely difficult to estimate a definitive date of infection peak, given limited surveillance data from this period. But the analysis method is useful complement to other work on this topic (e.g. medrxiv.org/content/10.110… & nature.com/articles/s4158…) 3/
In particular, Wood's paper (like others) has to assume certain distribution of delay from infection to death. It uses early estimate from here: thelancet.com/journals/lanin…, which is reasonable starting point, but if real delay is longer/shorter, peak time will shift accordingly 4/
Using that distribution, the analysis suggests UK infections peaked around 18-21 March (for context: schools, pubs, clubs, gyms, restaurants etc. were ordered to close on 20th). But this doesn't necessarily mean that measures introduced after the peak had no effect... 5/
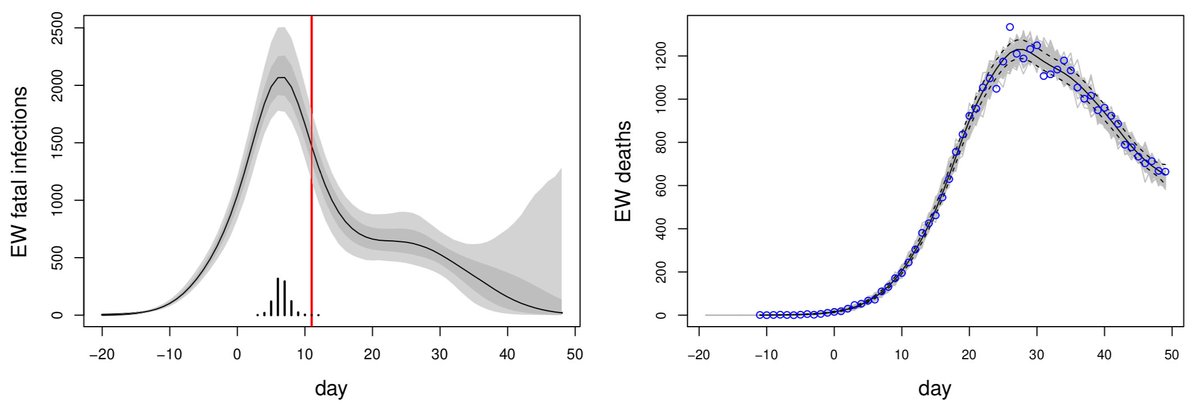
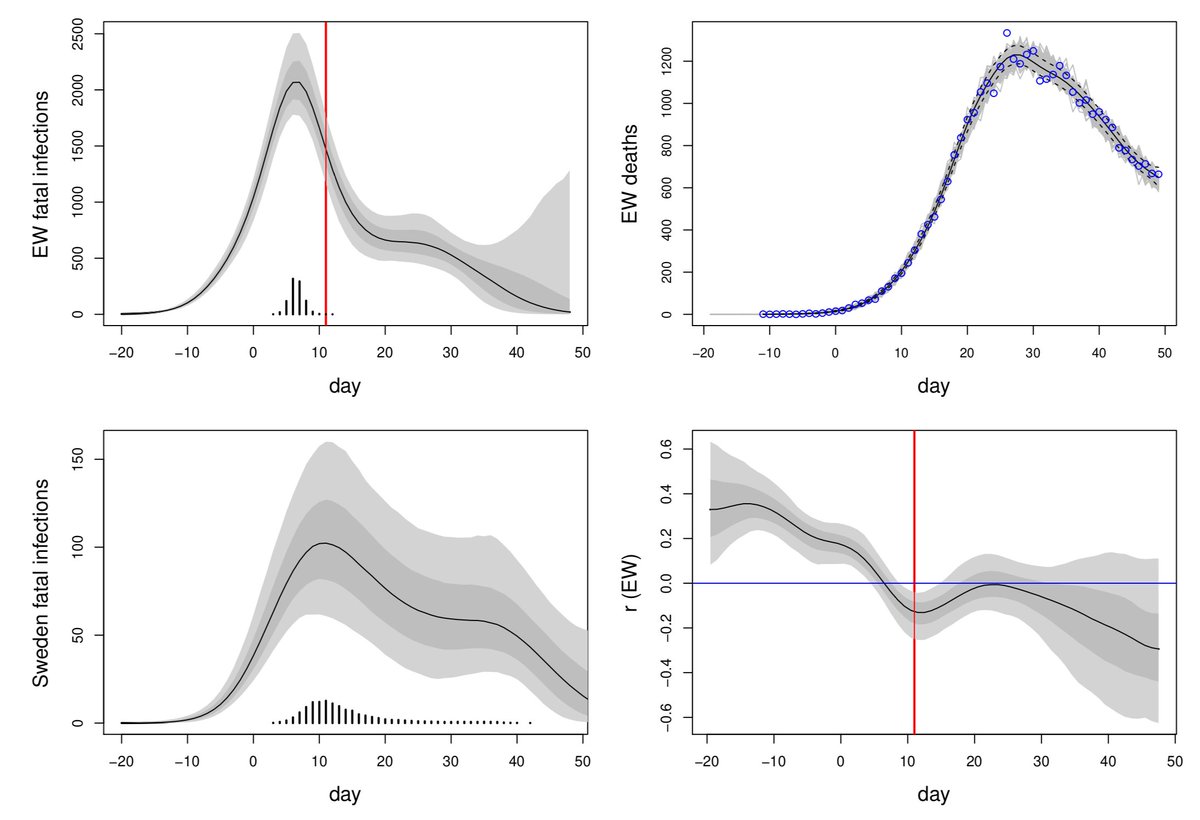
At an epidemic peak the growth rate is zero: if no further decline had happened, the epidemic would have stayed at this level, in this case at around 2000 estimated fatal infections per day (blue line added by me)... 6/
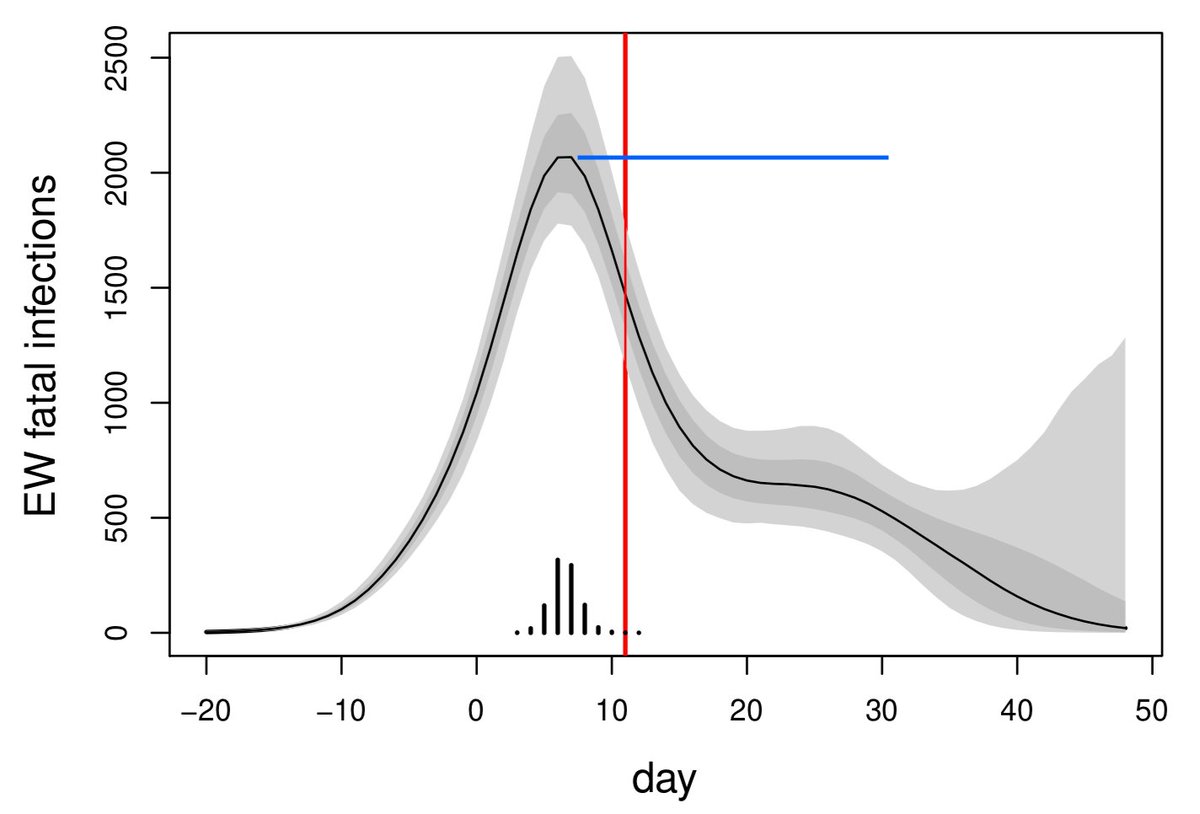
For the epidemic to decline, the growth rate has to be less than zero. If it's not that far below zero, we'd see a decline but a gradual one, e.g. like the paper estimates just after the peak... 7/
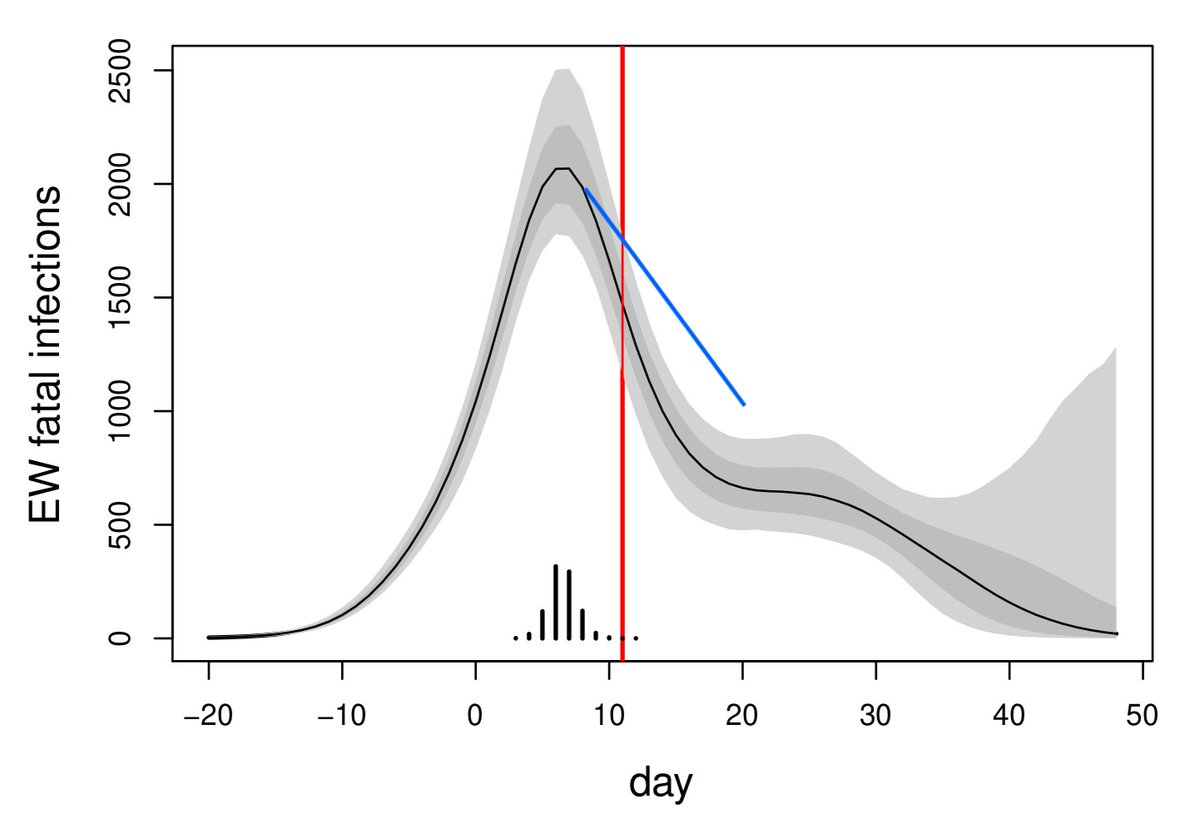
How much further ahead do we have to go to see the steepest decline? The paper actually estimates this, and suggests that the fastest rate of post-peak decline was probably happening around 24-26 March. 8/
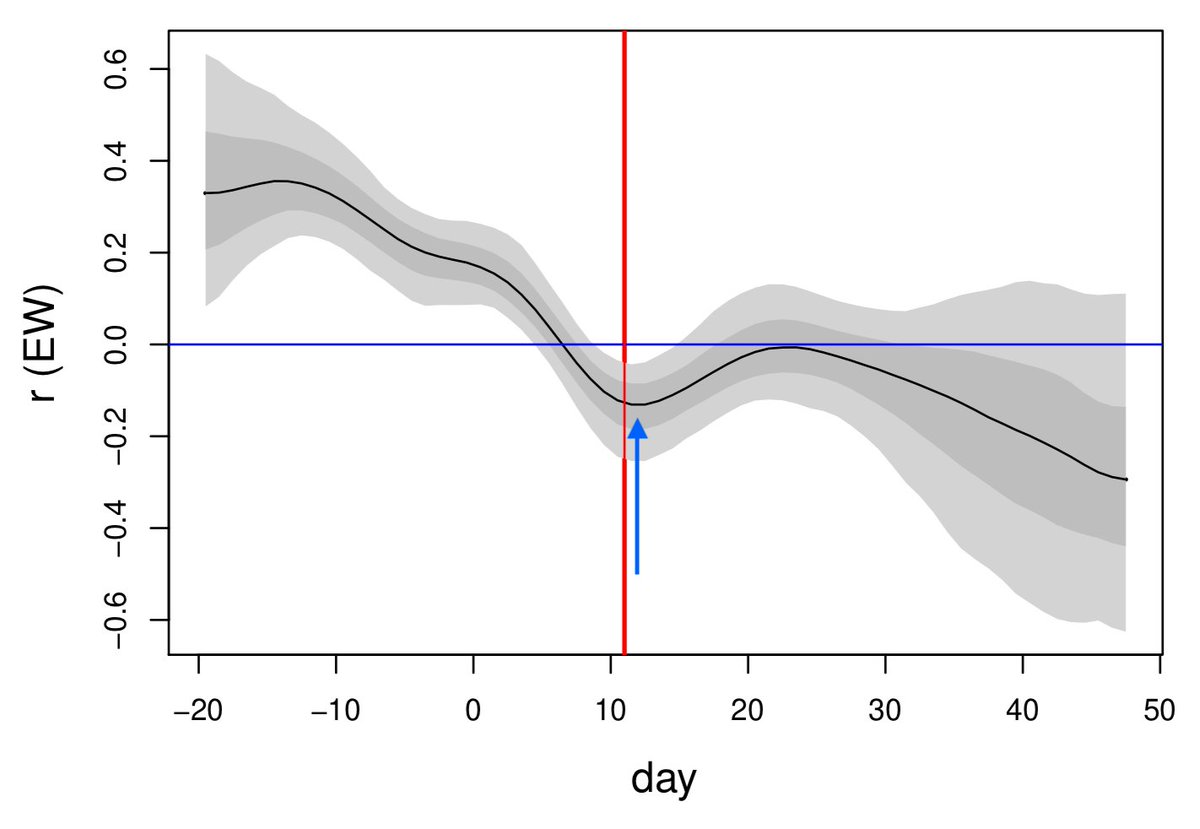
Note uncertainty around dates in these estimates: the light grey area shows 95% credible interval for the infection trajectories estimated by the model. Clearly there are several different shape curves (w/ different peak times) we could draw that would lie within this boundary 9/
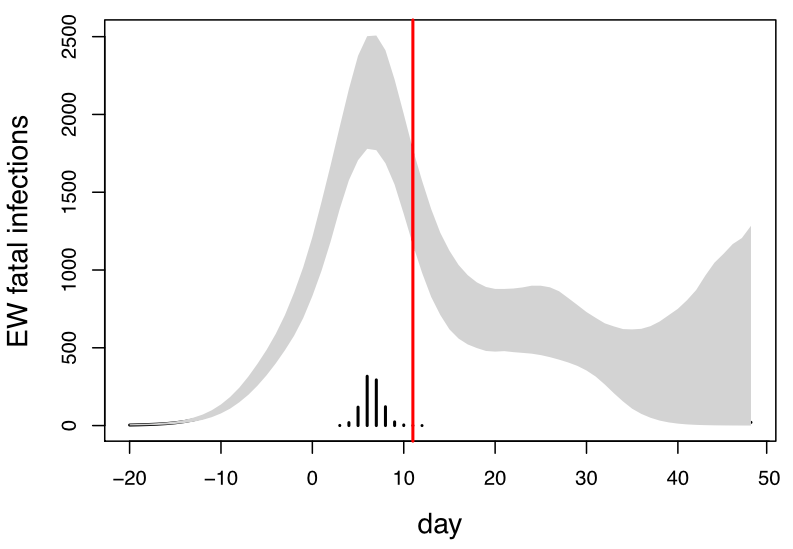
Overall, it highlights that it's not that helpful to talk about 'lockdown' as a simple on/off binary measure – countries introduced a whole range of stringent (and often interdependent) measures around the same time, some of which will have had more impact that others. 10/
Different countries have used different combinations of measures, introduced in different sequences, against a background of different outbreak dynamics. Understanding the most effective and efficient way to maintain ongoing control in future will therefore be crucial. 11/11

