
It’s the end of #bikeweek2020, so I’ve taken a look at the #opendata from #edinburghcyclehire. A thread. 

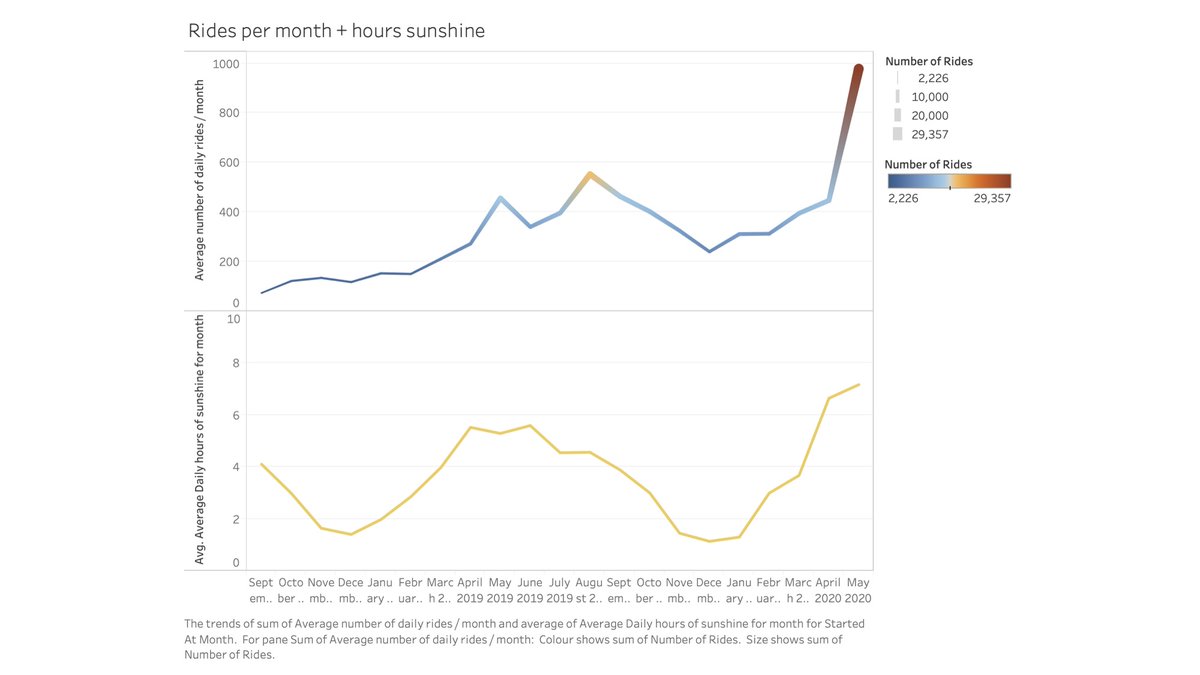
Firstly, looks like it’s getting more popular over time. In particular recently.

April & May 2020 were very sunny months which probably helped, but it looks like cycling has also increased since the COVID-19 lockdown.
heraldscotland.com/news/18377069.…
heraldscotland.com/news/18377069.…
Over the week there are distinct patterns of use depending on day of the week and time of day. On weekdays, there’s a small peak from ~8-9am, with use growing again from ~12noon, and a later peak at ~4-6pm. Average hire hovers around 30minutes.

On weekdays from 8-9am the starting locations are fairly diffusely spread.

But at 4-5pm they are more concentrated (central areas, King’s buildings, Victoria Quay).

At the weekend, there is a single broader peak spanning ~11am-5pm. Average hire duration is longer at ~40minutes.

And the starting hire locations (2-3pm shown here) are fairly diffusely spread.

Cycle data from:
edinburghcyclehire.com/open-data
Sunshine data from the Met Office Scotland East dataset:
metoffice.gov.uk/research/clima…
Visualisations made with Tableau, a number inspired from this London Cycle Hire one. Go look:
public.tableau.com/profile/roby.j…
Happy cycling folks.
edinburghcyclehire.com/open-data
Sunshine data from the Met Office Scotland East dataset:
metoffice.gov.uk/research/clima…
Visualisations made with Tableau, a number inspired from this London Cycle Hire one. Go look:
public.tableau.com/profile/roby.j…
Happy cycling folks.
Predictably, there are many ways to look at this data, and so there are now a few more slides. First up, I've updated the slide that shows days and times of use. The data is pretty skewed (more on that later) and so it now shows both mean and median durations.

Using the median length of rides, during the week the median length is around 15 minutes, with this rising quite substantially to around 24 minutes on both Saturday and Sunday.
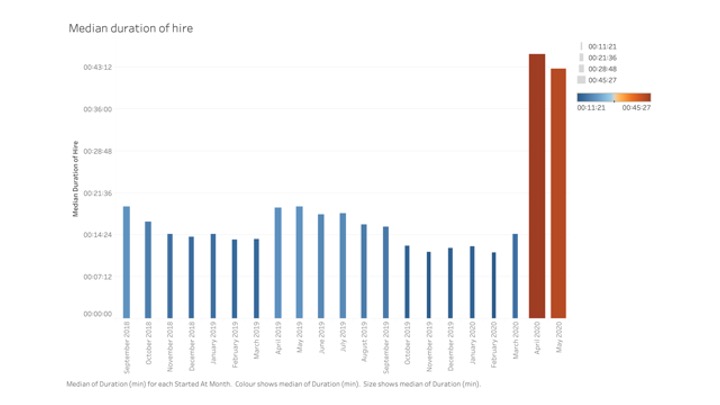
Looking into duration of rides in a bit more depth, turns out there has been a quite a change in duration of hires in April and May 2020. This had been pointed out by my friend @wulliemair in a reply earlier in this thread so I thought I'd try to visualise it. Quite striking.
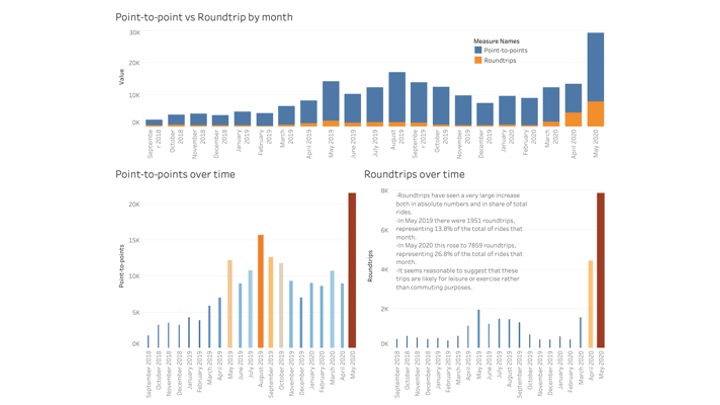
Related to this was another insight from @wulliemair that there seemed to be more roundtrips recently. Assuming (I hope safely!) that starting and finishing at the same place is not your commute, this looks like an increase in people using these bikes for leisure or exercise.
Whether the time of use has changed much recently is also of interest. On weekdays, it looks like there's been quite a significant shift in pattern from twin peaks at rush hours to a much broader, single peak that looks much more like typical weekend usage.

At the weekends, the pattern of usage looks much the same, as you might expect.

I've uploaded all these slides on an interactive storyboard over on @tableaupublic that I'll try to update periodically. Any suggestions welcome, and I'll try to incorporate if I can.
public.tableau.com/views/Edinburg…
public.tableau.com/views/Edinburg…

