Update 21 June (thread)
91 new confirmed cases (total: 49.593)
1 new fatalities (total: 6.090)
3 new hospitalisations (total: 11.849)
The map shows cases, hospitalisations and fatalities in nominal, per capita and growth figures.
(RIVM)
#coronakaart #coronavirusNL #COVID19NL
91 new confirmed cases (total: 49.593)
1 new fatalities (total: 6.090)
3 new hospitalisations (total: 11.849)
The map shows cases, hospitalisations and fatalities in nominal, per capita and growth figures.
(RIVM)
#coronakaart #coronavirusNL #COVID19NL

The growth maps (bottom three) in the graph above are slightly different than previously. It now shows the growth in cases, fatalities and hospitalisations (in %) compared to last week. Only municipalities with non-zero growth are shown.
The total number of hospitalisations, cases and fatalities due to #COVID19 per Dutch province.
#coronakaart #coronavirusNL #coronavirusNederland
#coronakaart #coronavirusNL #coronavirusNederland

3 municipalities report one new hospitalisation due to #COVID19, compared to yesterday.
3 new hospitalisations are located and 0 hospitalisations are removed.
#coronakaart #coronavirusNL #CoronaCrisis
3 new hospitalisations are located and 0 hospitalisations are removed.
#coronakaart #coronavirusNL #CoronaCrisis

56 municipalities report at least one new cases of #COVID19, compared to yesterday.
98 new cases are located and 7 cases are removed.
The biggest increase is in Amsterdam, Rotterdam and Utrecht (+6), biggest decrease in Zaanstad (-4).
#coronakaart #coronavirusNL #CoronaCrisis
98 new cases are located and 7 cases are removed.
The biggest increase is in Amsterdam, Rotterdam and Utrecht (+6), biggest decrease in Zaanstad (-4).
#coronakaart #coronavirusNL #CoronaCrisis

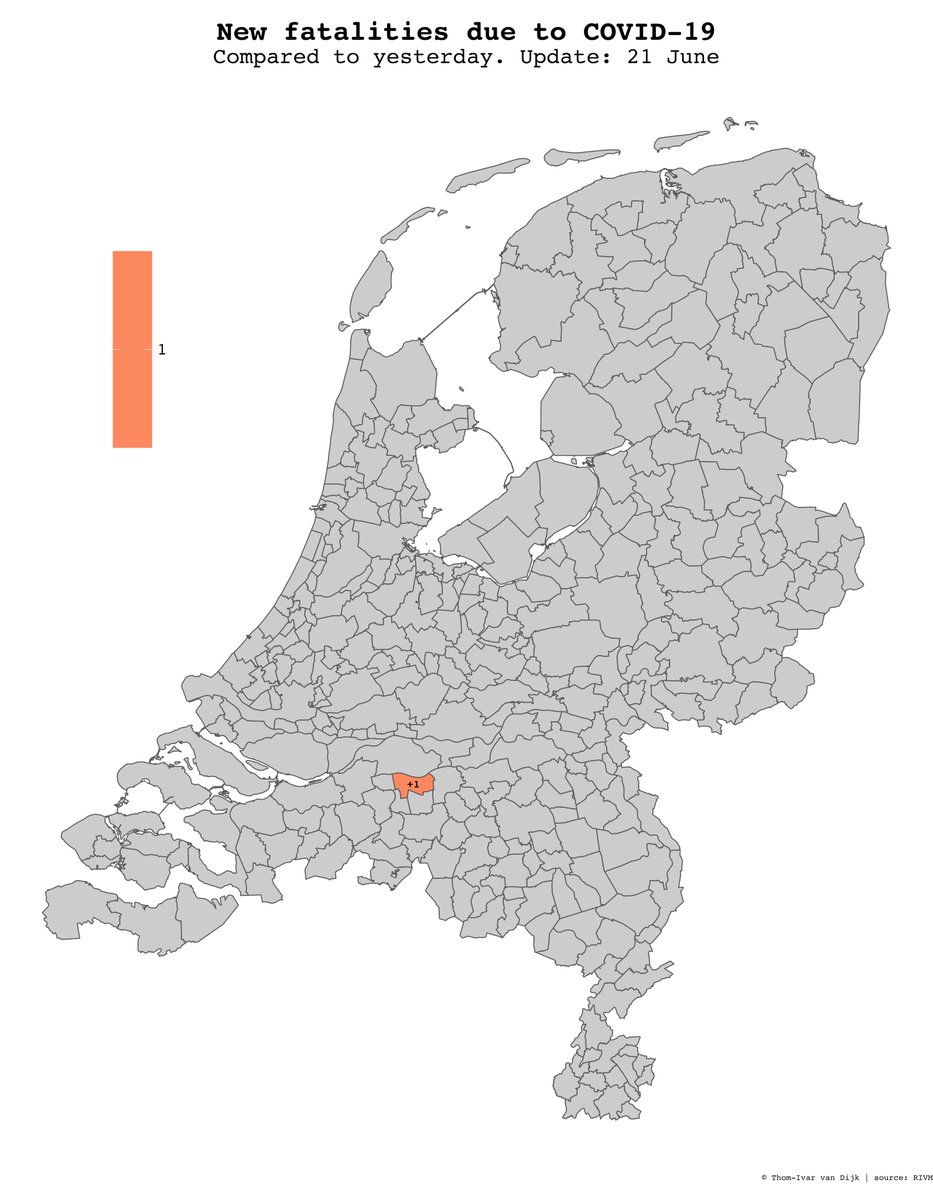
1 municipality (Waalwijk) reports one new fatality due to #COVID19, compared to yesterday.
1 new fatality is located and 0 fatalities are removed.
#coronakaart #coronavirusNL #CoronaCrisis
1 new fatality is located and 0 fatalities are removed.
#coronakaart #coronavirusNL #CoronaCrisis

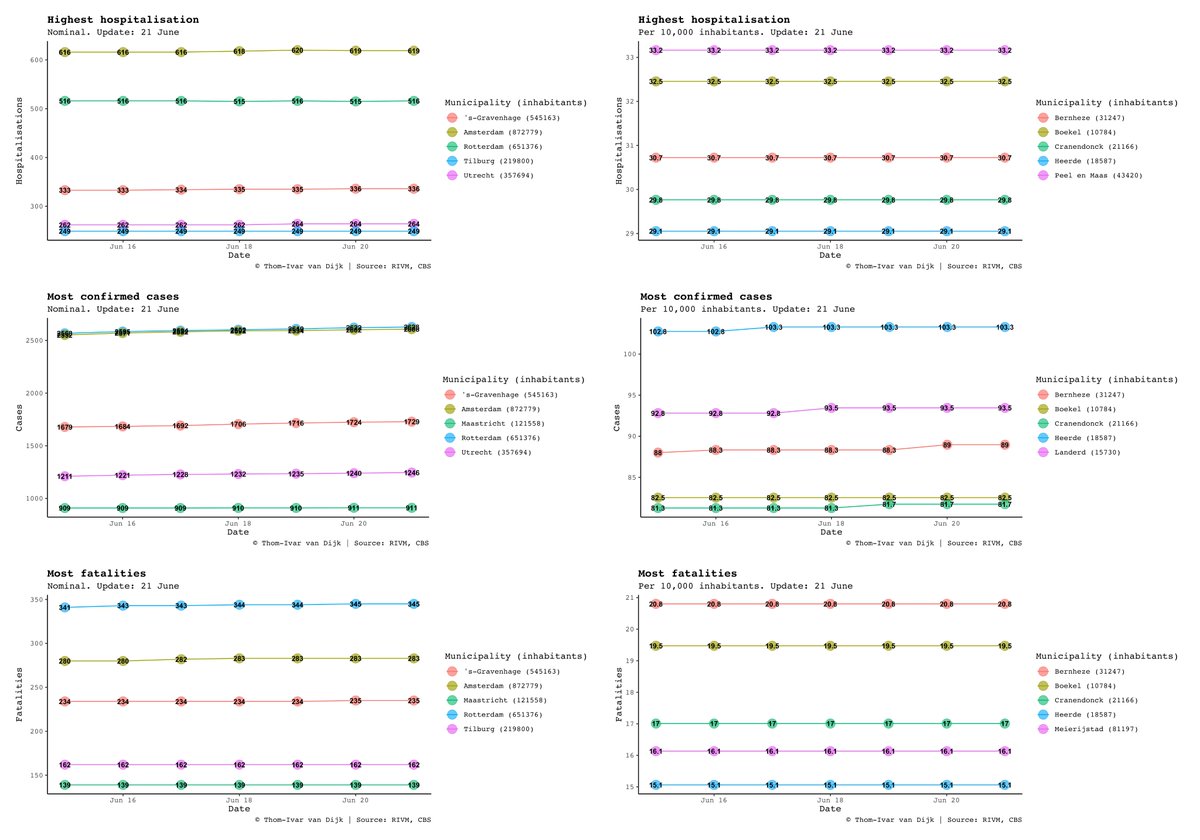
Municipalities with most cases, hospitalisations and fatalities, both nominal as well as per 10,000 inhabitants.
#coronavirusNL #COVID19NL
#coronavirusNL #COVID19NL

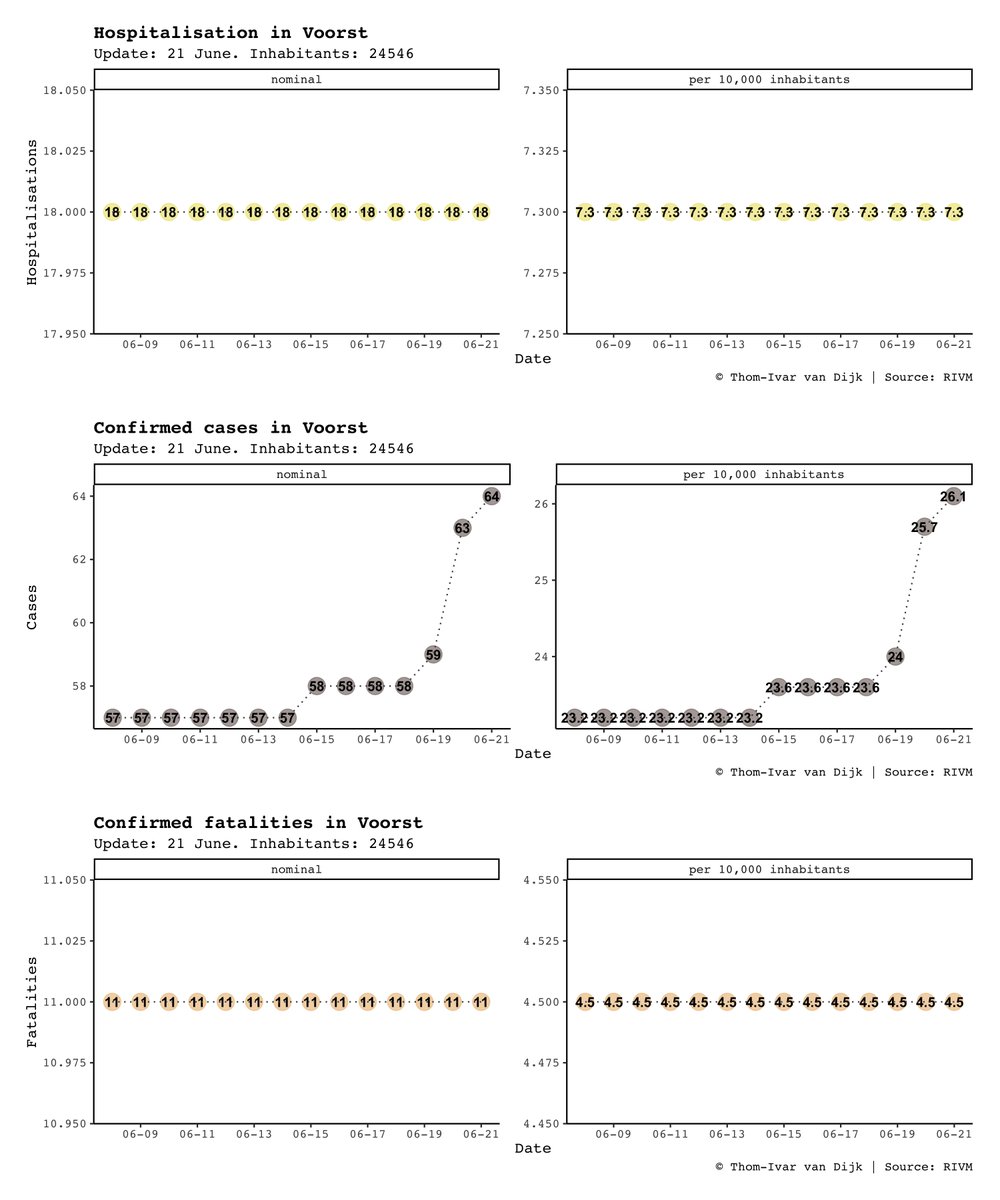
Voorst has the highest growth rate of confirmed cases over the last week, measured as the difference in percentage (+12.28%).
Graphs for other municipalities available on request!
#coronavirusNL #COVID19NL
Graphs for other municipalities available on request!
#coronavirusNL #COVID19NL

Unfortunately, 1 new fatality is reported. There might be some delay in these reports. Growth rates are rounded to the nearest tenth.
The youngest deceased (out of all deceased) is between 15 and 19.
#coronavirusNL #COVID19NL
The youngest deceased (out of all deceased) is between 15 and 19.
#coronavirusNL #COVID19NL

Absolute new cases of #COVID19 per Dutch province:
Drenthe, Flevoland, Friesland, Groningen, Zeeland (+0)
Limburg, Noord-Holland (+5)
Gelderland, Overijssel (+13)
Utrecht (+14)
Noord-Brabant (+16)
Zuid-Holland (+25)
#coronavirusNL
Drenthe, Flevoland, Friesland, Groningen, Zeeland (+0)
Limburg, Noord-Holland (+5)
Gelderland, Overijssel (+13)
Utrecht (+14)
Noord-Brabant (+16)
Zuid-Holland (+25)
#coronavirusNL
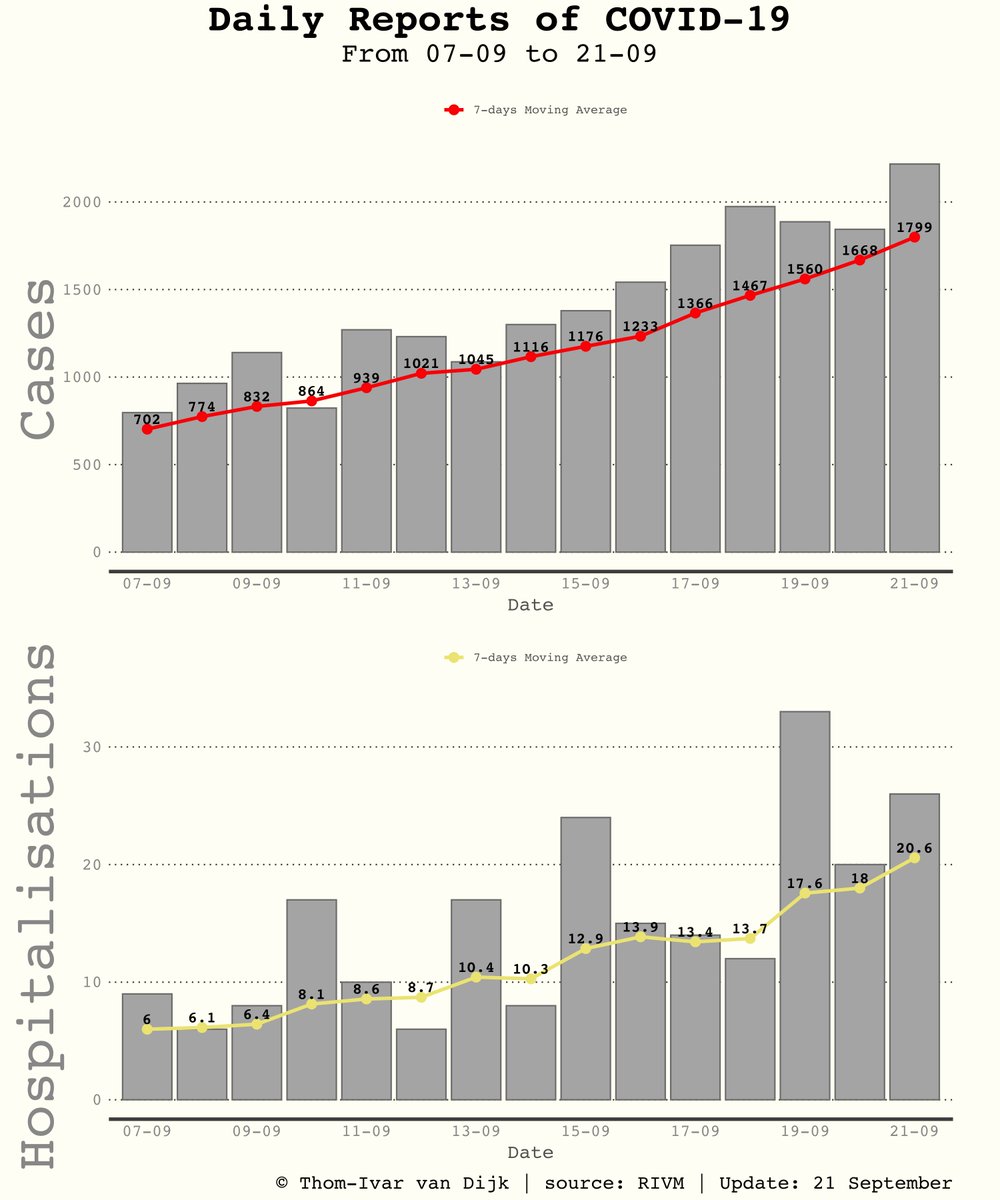
New reported COVID-19 cases per Dutch province over time. The graph shows the absolute number of newly reported cases, as provided in the daily report of the RIVM.
#coronavirusNL #COVID19NL
#coronavirusNL #COVID19NL

• • •
Missing some Tweet in this thread? You can try to
force a refresh


